Immigrants from Belarus vs Houma In Labor Force | Age 30-34
COMPARE
Immigrants from Belarus
Houma
In Labor Force | Age 30-34
In Labor Force | Age 30-34 Comparison
Immigrants from Belarus
Houma
85.2%
IN LABOR FORCE | AGE 30-34
96.9/ 100
METRIC RATING
101st/ 347
METRIC RANK
79.9%
IN LABOR FORCE | AGE 30-34
0.0/ 100
METRIC RATING
331st/ 347
METRIC RANK
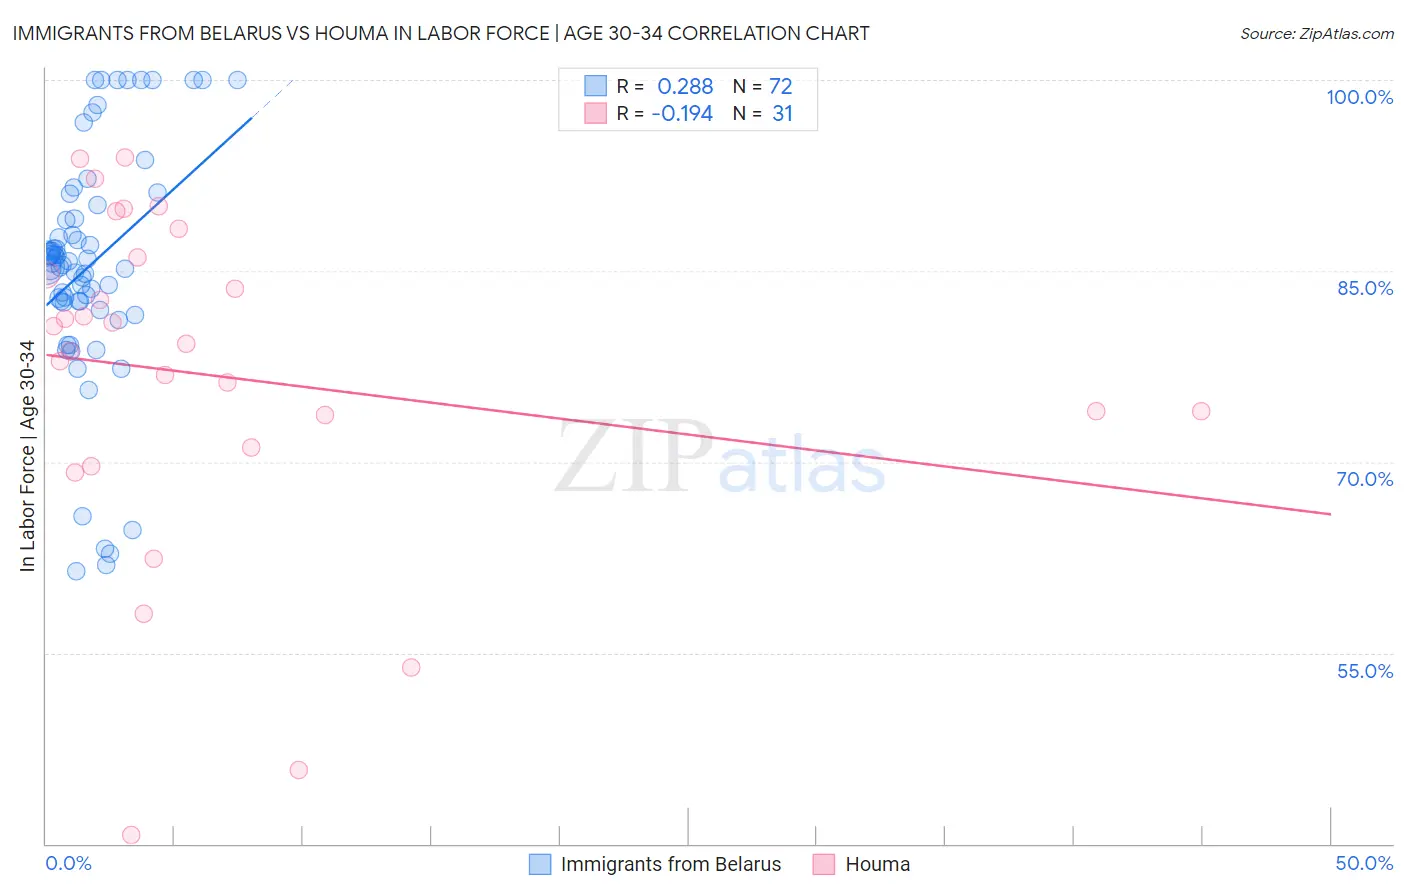
Immigrants from Belarus vs Houma In Labor Force | Age 30-34 Correlation Chart
The statistical analysis conducted on geographies consisting of 150,197,798 people shows a weak positive correlation between the proportion of Immigrants from Belarus and labor force participation rate among population between the ages 30 and 34 in the United States with a correlation coefficient (R) of 0.288 and weighted average of 85.2%. Similarly, the statistical analysis conducted on geographies consisting of 36,791,353 people shows a poor negative correlation between the proportion of Houma and labor force participation rate among population between the ages 30 and 34 in the United States with a correlation coefficient (R) of -0.194 and weighted average of 79.9%, a difference of 6.6%.
In Labor Force | Age 30-34 Correlation Summary
| Measurement | Immigrants from Belarus | Houma |
| Minimum | 61.4% | 40.7% |
| Maximum | 100.0% | 93.9% |
| Range | 38.6% | 53.2% |
| Mean | 85.4% | 76.8% |
| Median | 85.5% | 79.3% |
| Interquartile 25% (IQ1) | 82.6% | 71.1% |
| Interquartile 75% (IQ3) | 89.7% | 86.1% |
| Interquartile Range (IQR) | 7.1% | 15.0% |
| Standard Deviation (Sample) | 9.3% | 13.3% |
| Standard Deviation (Population) | 9.2% | 13.1% |
Similar Demographics by In Labor Force | Age 30-34
Demographics Similar to Immigrants from Belarus by In Labor Force | Age 30-34
In terms of in labor force | age 30-34, the demographic groups most similar to Immigrants from Belarus are Belgian (85.2%, a difference of 0.010%), Sudanese (85.2%, a difference of 0.010%), Immigrants from Austria (85.2%, a difference of 0.010%), Immigrants from Korea (85.2%, a difference of 0.020%), and Thai (85.2%, a difference of 0.020%).
| Demographics | Rating | Rank | In Labor Force | Age 30-34 |
| Swedes | 97.5 /100 | #94 | Exceptional 85.2% |
| Immigrants | India | 97.4 /100 | #95 | Exceptional 85.2% |
| Immigrants | Korea | 97.3 /100 | #96 | Exceptional 85.2% |
| Thais | 97.2 /100 | #97 | Exceptional 85.2% |
| Immigrants | Uganda | 97.2 /100 | #98 | Exceptional 85.2% |
| Belgians | 97.2 /100 | #99 | Exceptional 85.2% |
| Sudanese | 97.1 /100 | #100 | Exceptional 85.2% |
| Immigrants | Belarus | 96.9 /100 | #101 | Exceptional 85.2% |
| Immigrants | Austria | 96.8 /100 | #102 | Exceptional 85.2% |
| Ukrainians | 96.6 /100 | #103 | Exceptional 85.2% |
| Immigrants | Ghana | 96.5 /100 | #104 | Exceptional 85.2% |
| Alsatians | 96.3 /100 | #105 | Exceptional 85.2% |
| Immigrants | Middle Africa | 96.3 /100 | #106 | Exceptional 85.2% |
| Immigrants | Northern Africa | 96.3 /100 | #107 | Exceptional 85.2% |
| Immigrants | Zimbabwe | 95.8 /100 | #108 | Exceptional 85.1% |
Demographics Similar to Houma by In Labor Force | Age 30-34
In terms of in labor force | age 30-34, the demographic groups most similar to Houma are Kiowa (79.8%, a difference of 0.11%), Pueblo (80.0%, a difference of 0.17%), Inupiat (79.7%, a difference of 0.22%), Sioux (80.4%, a difference of 0.58%), and Creek (80.4%, a difference of 0.58%).
| Demographics | Rating | Rank | In Labor Force | Age 30-34 |
| Cheyenne | 0.0 /100 | #324 | Tragic 81.1% |
| Dutch West Indians | 0.0 /100 | #325 | Tragic 81.0% |
| Seminole | 0.0 /100 | #326 | Tragic 80.8% |
| Colville | 0.0 /100 | #327 | Tragic 80.7% |
| Sioux | 0.0 /100 | #328 | Tragic 80.4% |
| Creek | 0.0 /100 | #329 | Tragic 80.4% |
| Pueblo | 0.0 /100 | #330 | Tragic 80.0% |
| Houma | 0.0 /100 | #331 | Tragic 79.9% |
| Kiowa | 0.0 /100 | #332 | Tragic 79.8% |
| Inupiat | 0.0 /100 | #333 | Tragic 79.7% |
| Hopi | 0.0 /100 | #334 | Tragic 79.3% |
| Marshallese | 0.0 /100 | #335 | Tragic 79.2% |
| Natives/Alaskans | 0.0 /100 | #336 | Tragic 79.2% |
| Yakama | 0.0 /100 | #337 | Tragic 79.1% |
| Pima | 0.0 /100 | #338 | Tragic 79.0% |