Guyanese vs Houma In Labor Force | Age 30-34
COMPARE
Guyanese
Houma
In Labor Force | Age 30-34
In Labor Force | Age 30-34 Comparison
Guyanese
Houma
83.8%
IN LABOR FORCE | AGE 30-34
0.3/ 100
METRIC RATING
261st/ 347
METRIC RANK
79.9%
IN LABOR FORCE | AGE 30-34
0.0/ 100
METRIC RATING
331st/ 347
METRIC RANK
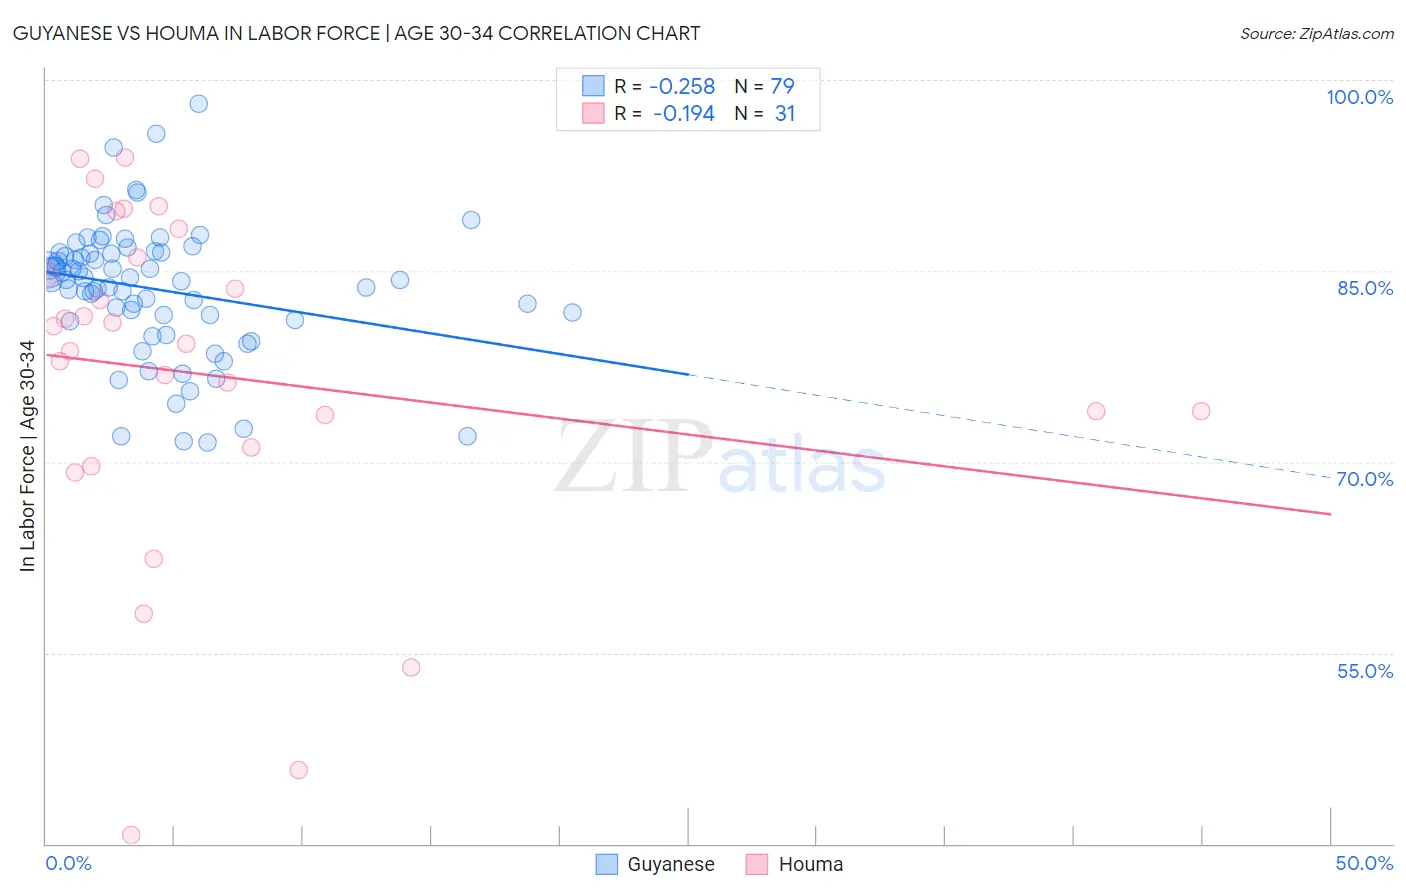
Guyanese vs Houma In Labor Force | Age 30-34 Correlation Chart
The statistical analysis conducted on geographies consisting of 176,819,802 people shows a weak negative correlation between the proportion of Guyanese and labor force participation rate among population between the ages 30 and 34 in the United States with a correlation coefficient (R) of -0.258 and weighted average of 83.8%. Similarly, the statistical analysis conducted on geographies consisting of 36,791,353 people shows a poor negative correlation between the proportion of Houma and labor force participation rate among population between the ages 30 and 34 in the United States with a correlation coefficient (R) of -0.194 and weighted average of 79.9%, a difference of 4.9%.
In Labor Force | Age 30-34 Correlation Summary
| Measurement | Guyanese | Houma |
| Minimum | 71.5% | 40.7% |
| Maximum | 98.1% | 93.9% |
| Range | 26.6% | 53.2% |
| Mean | 83.5% | 76.8% |
| Median | 84.3% | 79.3% |
| Interquartile 25% (IQ1) | 81.1% | 71.1% |
| Interquartile 75% (IQ3) | 86.4% | 86.1% |
| Interquartile Range (IQR) | 5.3% | 15.0% |
| Standard Deviation (Sample) | 5.2% | 13.3% |
| Standard Deviation (Population) | 5.2% | 13.1% |
Similar Demographics by In Labor Force | Age 30-34
Demographics Similar to Guyanese by In Labor Force | Age 30-34
In terms of in labor force | age 30-34, the demographic groups most similar to Guyanese are Immigrants from Dominican Republic (83.8%, a difference of 0.010%), Scotch-Irish (83.8%, a difference of 0.020%), Dominican (83.8%, a difference of 0.020%), Immigrants from Guyana (83.8%, a difference of 0.020%), and Honduran (83.8%, a difference of 0.030%).
| Demographics | Rating | Rank | In Labor Force | Age 30-34 |
| Immigrants | St. Vincent and the Grenadines | 0.5 /100 | #254 | Tragic 83.9% |
| Whites/Caucasians | 0.5 /100 | #255 | Tragic 83.9% |
| Immigrants | Lebanon | 0.4 /100 | #256 | Tragic 83.9% |
| Iraqis | 0.3 /100 | #257 | Tragic 83.8% |
| Hondurans | 0.3 /100 | #258 | Tragic 83.8% |
| Scotch-Irish | 0.3 /100 | #259 | Tragic 83.8% |
| Immigrants | Dominican Republic | 0.3 /100 | #260 | Tragic 83.8% |
| Guyanese | 0.3 /100 | #261 | Tragic 83.8% |
| Dominicans | 0.2 /100 | #262 | Tragic 83.8% |
| Immigrants | Guyana | 0.2 /100 | #263 | Tragic 83.8% |
| Guatemalans | 0.2 /100 | #264 | Tragic 83.7% |
| Immigrants | Honduras | 0.1 /100 | #265 | Tragic 83.7% |
| Immigrants | Guatemala | 0.1 /100 | #266 | Tragic 83.7% |
| Spaniards | 0.1 /100 | #267 | Tragic 83.6% |
| Immigrants | Bangladesh | 0.1 /100 | #268 | Tragic 83.6% |
Demographics Similar to Houma by In Labor Force | Age 30-34
In terms of in labor force | age 30-34, the demographic groups most similar to Houma are Kiowa (79.8%, a difference of 0.11%), Pueblo (80.0%, a difference of 0.17%), Inupiat (79.7%, a difference of 0.22%), Sioux (80.4%, a difference of 0.58%), and Creek (80.4%, a difference of 0.58%).
| Demographics | Rating | Rank | In Labor Force | Age 30-34 |
| Cheyenne | 0.0 /100 | #324 | Tragic 81.1% |
| Dutch West Indians | 0.0 /100 | #325 | Tragic 81.0% |
| Seminole | 0.0 /100 | #326 | Tragic 80.8% |
| Colville | 0.0 /100 | #327 | Tragic 80.7% |
| Sioux | 0.0 /100 | #328 | Tragic 80.4% |
| Creek | 0.0 /100 | #329 | Tragic 80.4% |
| Pueblo | 0.0 /100 | #330 | Tragic 80.0% |
| Houma | 0.0 /100 | #331 | Tragic 79.9% |
| Kiowa | 0.0 /100 | #332 | Tragic 79.8% |
| Inupiat | 0.0 /100 | #333 | Tragic 79.7% |
| Hopi | 0.0 /100 | #334 | Tragic 79.3% |
| Marshallese | 0.0 /100 | #335 | Tragic 79.2% |
| Natives/Alaskans | 0.0 /100 | #336 | Tragic 79.2% |
| Yakama | 0.0 /100 | #337 | Tragic 79.1% |
| Pima | 0.0 /100 | #338 | Tragic 79.0% |