Immigrants from Belarus vs Houma In Labor Force | Age 20-24
COMPARE
Immigrants from Belarus
Houma
In Labor Force | Age 20-24
In Labor Force | Age 20-24 Comparison
Immigrants from Belarus
Houma
73.0%
IN LABOR FORCE | AGE 20-24
0.1/ 100
METRIC RATING
290th/ 347
METRIC RANK
73.7%
IN LABOR FORCE | AGE 20-24
0.6/ 100
METRIC RATING
261st/ 347
METRIC RANK
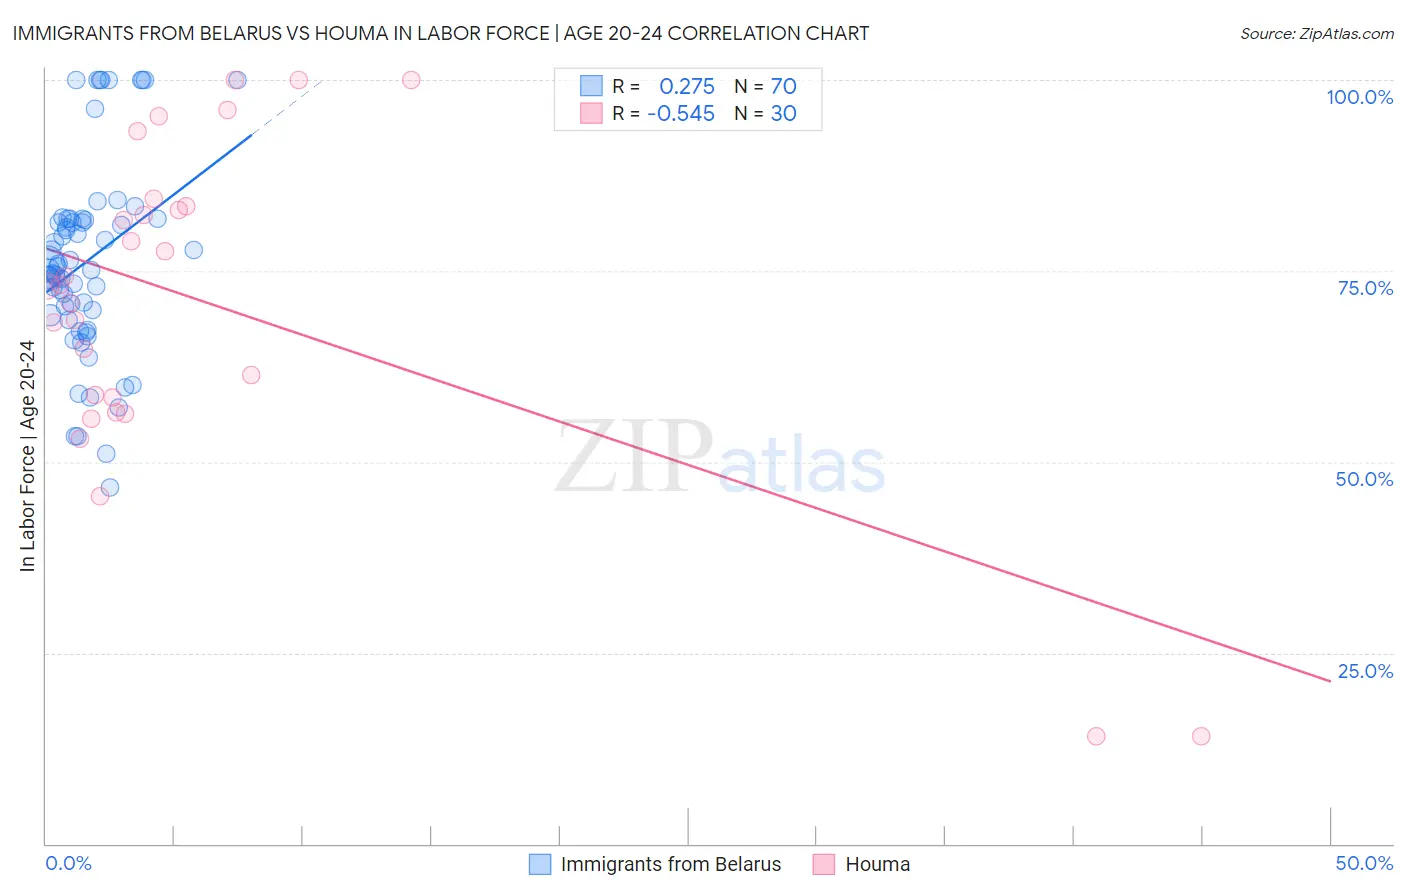
Immigrants from Belarus vs Houma In Labor Force | Age 20-24 Correlation Chart
The statistical analysis conducted on geographies consisting of 150,196,069 people shows a weak positive correlation between the proportion of Immigrants from Belarus and labor force participation rate among population between the ages 20 and 24 in the United States with a correlation coefficient (R) of 0.275 and weighted average of 73.0%. Similarly, the statistical analysis conducted on geographies consisting of 36,797,175 people shows a substantial negative correlation between the proportion of Houma and labor force participation rate among population between the ages 20 and 24 in the United States with a correlation coefficient (R) of -0.545 and weighted average of 73.7%, a difference of 0.92%.
In Labor Force | Age 20-24 Correlation Summary
| Measurement | Immigrants from Belarus | Houma |
| Minimum | 46.6% | 14.1% |
| Maximum | 100.0% | 100.0% |
| Range | 53.4% | 85.9% |
| Mean | 76.3% | 70.7% |
| Median | 75.4% | 73.1% |
| Interquartile 25% (IQ1) | 69.2% | 58.4% |
| Interquartile 75% (IQ3) | 81.8% | 83.5% |
| Interquartile Range (IQR) | 12.6% | 25.1% |
| Standard Deviation (Sample) | 12.7% | 21.7% |
| Standard Deviation (Population) | 12.6% | 21.3% |
Similar Demographics by In Labor Force | Age 20-24
Demographics Similar to Immigrants from Belarus by In Labor Force | Age 20-24
In terms of in labor force | age 20-24, the demographic groups most similar to Immigrants from Belarus are U.S. Virgin Islander (73.0%, a difference of 0.080%), Immigrants from Nicaragua (72.9%, a difference of 0.080%), Argentinean (73.1%, a difference of 0.11%), Pueblo (72.9%, a difference of 0.17%), and Immigrants from Korea (73.1%, a difference of 0.19%).
| Demographics | Rating | Rank | In Labor Force | Age 20-24 |
| Immigrants | Bahamas | 0.1 /100 | #283 | Tragic 73.2% |
| Kiowa | 0.1 /100 | #284 | Tragic 73.2% |
| Nicaraguans | 0.1 /100 | #285 | Tragic 73.2% |
| Immigrants | Lebanon | 0.1 /100 | #286 | Tragic 73.1% |
| Immigrants | Korea | 0.1 /100 | #287 | Tragic 73.1% |
| Argentineans | 0.1 /100 | #288 | Tragic 73.1% |
| U.S. Virgin Islanders | 0.1 /100 | #289 | Tragic 73.0% |
| Immigrants | Belarus | 0.1 /100 | #290 | Tragic 73.0% |
| Immigrants | Nicaragua | 0.0 /100 | #291 | Tragic 72.9% |
| Pueblo | 0.0 /100 | #292 | Tragic 72.9% |
| Immigrants | Belize | 0.0 /100 | #293 | Tragic 72.8% |
| Immigrants | Argentina | 0.0 /100 | #294 | Tragic 72.8% |
| Okinawans | 0.0 /100 | #295 | Tragic 72.7% |
| Jamaicans | 0.0 /100 | #296 | Tragic 72.7% |
| Central American Indians | 0.0 /100 | #297 | Tragic 72.7% |
Demographics Similar to Houma by In Labor Force | Age 20-24
In terms of in labor force | age 20-24, the demographic groups most similar to Houma are Immigrants from Turkey (73.7%, a difference of 0.010%), Asian (73.7%, a difference of 0.010%), Egyptian (73.7%, a difference of 0.040%), Dutch West Indian (73.7%, a difference of 0.040%), and Paraguayan (73.7%, a difference of 0.080%).
| Demographics | Rating | Rank | In Labor Force | Age 20-24 |
| Ute | 1.0 /100 | #254 | Tragic 73.8% |
| Immigrants | Pakistan | 0.9 /100 | #255 | Tragic 73.8% |
| Spanish American Indians | 0.8 /100 | #256 | Tragic 73.7% |
| Paraguayans | 0.8 /100 | #257 | Tragic 73.7% |
| Egyptians | 0.7 /100 | #258 | Tragic 73.7% |
| Dutch West Indians | 0.7 /100 | #259 | Tragic 73.7% |
| Immigrants | Turkey | 0.7 /100 | #260 | Tragic 73.7% |
| Houma | 0.6 /100 | #261 | Tragic 73.7% |
| Asians | 0.6 /100 | #262 | Tragic 73.7% |
| Immigrants | Asia | 0.5 /100 | #263 | Tragic 73.6% |
| Immigrants | Haiti | 0.5 /100 | #264 | Tragic 73.6% |
| Burmese | 0.5 /100 | #265 | Tragic 73.6% |
| Haitians | 0.5 /100 | #266 | Tragic 73.6% |
| Immigrants | Western Asia | 0.4 /100 | #267 | Tragic 73.5% |
| South Americans | 0.4 /100 | #268 | Tragic 73.5% |