Bhutanese vs Houma In Labor Force | Age 30-34
COMPARE
Bhutanese
Houma
In Labor Force | Age 30-34
In Labor Force | Age 30-34 Comparison
Bhutanese
Houma
85.0%
IN LABOR FORCE | AGE 30-34
87.5/ 100
METRIC RATING
139th/ 347
METRIC RANK
79.9%
IN LABOR FORCE | AGE 30-34
0.0/ 100
METRIC RATING
331st/ 347
METRIC RANK
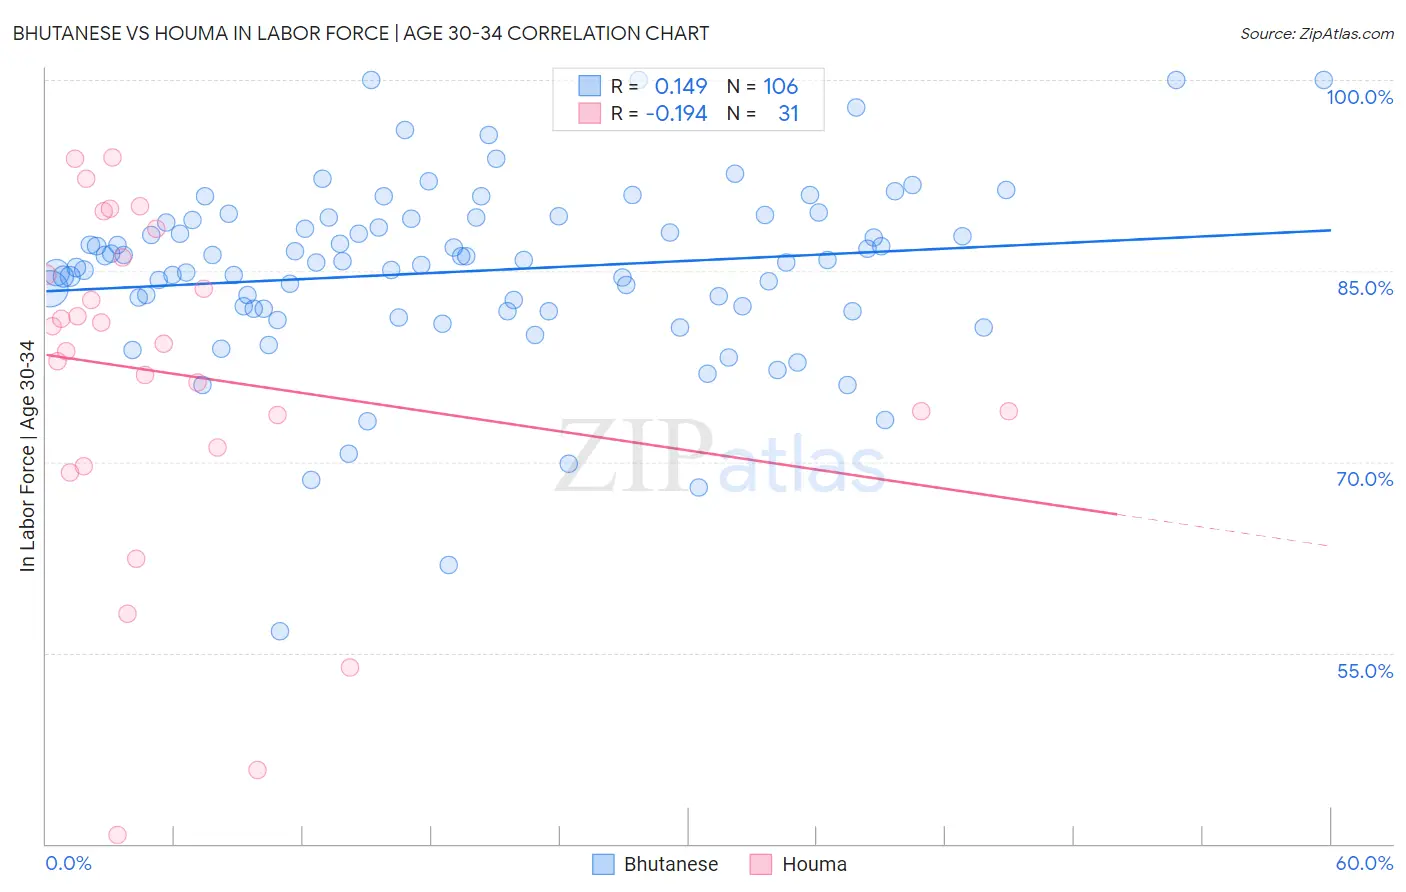
Bhutanese vs Houma In Labor Force | Age 30-34 Correlation Chart
The statistical analysis conducted on geographies consisting of 455,199,053 people shows a poor positive correlation between the proportion of Bhutanese and labor force participation rate among population between the ages 30 and 34 in the United States with a correlation coefficient (R) of 0.149 and weighted average of 85.0%. Similarly, the statistical analysis conducted on geographies consisting of 36,791,353 people shows a poor negative correlation between the proportion of Houma and labor force participation rate among population between the ages 30 and 34 in the United States with a correlation coefficient (R) of -0.194 and weighted average of 79.9%, a difference of 6.4%.
In Labor Force | Age 30-34 Correlation Summary
| Measurement | Bhutanese | Houma |
| Minimum | 56.7% | 40.7% |
| Maximum | 100.0% | 93.9% |
| Range | 43.3% | 53.2% |
| Mean | 85.0% | 76.8% |
| Median | 85.7% | 79.3% |
| Interquartile 25% (IQ1) | 82.0% | 71.1% |
| Interquartile 75% (IQ3) | 89.0% | 86.1% |
| Interquartile Range (IQR) | 7.0% | 15.0% |
| Standard Deviation (Sample) | 7.2% | 13.3% |
| Standard Deviation (Population) | 7.1% | 13.1% |
Similar Demographics by In Labor Force | Age 30-34
Demographics Similar to Bhutanese by In Labor Force | Age 30-34
In terms of in labor force | age 30-34, the demographic groups most similar to Bhutanese are South African (85.0%, a difference of 0.010%), Sri Lankan (85.0%, a difference of 0.010%), Immigrants from Asia (85.0%, a difference of 0.020%), Jordanian (85.0%, a difference of 0.020%), and Immigrants from Vietnam (85.0%, a difference of 0.020%).
| Demographics | Rating | Rank | In Labor Force | Age 30-34 |
| Immigrants | Israel | 89.5 /100 | #132 | Excellent 85.0% |
| New Zealanders | 89.5 /100 | #133 | Excellent 85.0% |
| Immigrants | Chile | 89.2 /100 | #134 | Excellent 85.0% |
| Immigrants | Asia | 88.9 /100 | #135 | Excellent 85.0% |
| Jordanians | 88.6 /100 | #136 | Excellent 85.0% |
| South Africans | 88.0 /100 | #137 | Excellent 85.0% |
| Sri Lankans | 87.8 /100 | #138 | Excellent 85.0% |
| Bhutanese | 87.5 /100 | #139 | Excellent 85.0% |
| Immigrants | Vietnam | 86.5 /100 | #140 | Excellent 85.0% |
| Chileans | 85.3 /100 | #141 | Excellent 84.9% |
| Immigrants | Indonesia | 84.3 /100 | #142 | Excellent 84.9% |
| Colombians | 82.2 /100 | #143 | Excellent 84.9% |
| Uruguayans | 78.5 /100 | #144 | Good 84.9% |
| Palestinians | 77.7 /100 | #145 | Good 84.9% |
| Immigrants | Saudi Arabia | 76.6 /100 | #146 | Good 84.9% |
Demographics Similar to Houma by In Labor Force | Age 30-34
In terms of in labor force | age 30-34, the demographic groups most similar to Houma are Kiowa (79.8%, a difference of 0.11%), Pueblo (80.0%, a difference of 0.17%), Inupiat (79.7%, a difference of 0.22%), Sioux (80.4%, a difference of 0.58%), and Creek (80.4%, a difference of 0.58%).
| Demographics | Rating | Rank | In Labor Force | Age 30-34 |
| Cheyenne | 0.0 /100 | #324 | Tragic 81.1% |
| Dutch West Indians | 0.0 /100 | #325 | Tragic 81.0% |
| Seminole | 0.0 /100 | #326 | Tragic 80.8% |
| Colville | 0.0 /100 | #327 | Tragic 80.7% |
| Sioux | 0.0 /100 | #328 | Tragic 80.4% |
| Creek | 0.0 /100 | #329 | Tragic 80.4% |
| Pueblo | 0.0 /100 | #330 | Tragic 80.0% |
| Houma | 0.0 /100 | #331 | Tragic 79.9% |
| Kiowa | 0.0 /100 | #332 | Tragic 79.8% |
| Inupiat | 0.0 /100 | #333 | Tragic 79.7% |
| Hopi | 0.0 /100 | #334 | Tragic 79.3% |
| Marshallese | 0.0 /100 | #335 | Tragic 79.2% |
| Natives/Alaskans | 0.0 /100 | #336 | Tragic 79.2% |
| Yakama | 0.0 /100 | #337 | Tragic 79.1% |
| Pima | 0.0 /100 | #338 | Tragic 79.0% |