Immigrants from Belarus vs Immigrants from El Salvador In Labor Force | Age 30-34
COMPARE
Immigrants from Belarus
Immigrants from El Salvador
In Labor Force | Age 30-34
In Labor Force | Age 30-34 Comparison
Immigrants from Belarus
Immigrants from El Salvador
85.2%
IN LABOR FORCE | AGE 30-34
96.9/ 100
METRIC RATING
101st/ 347
METRIC RANK
84.2%
IN LABOR FORCE | AGE 30-34
3.0/ 100
METRIC RATING
226th/ 347
METRIC RANK
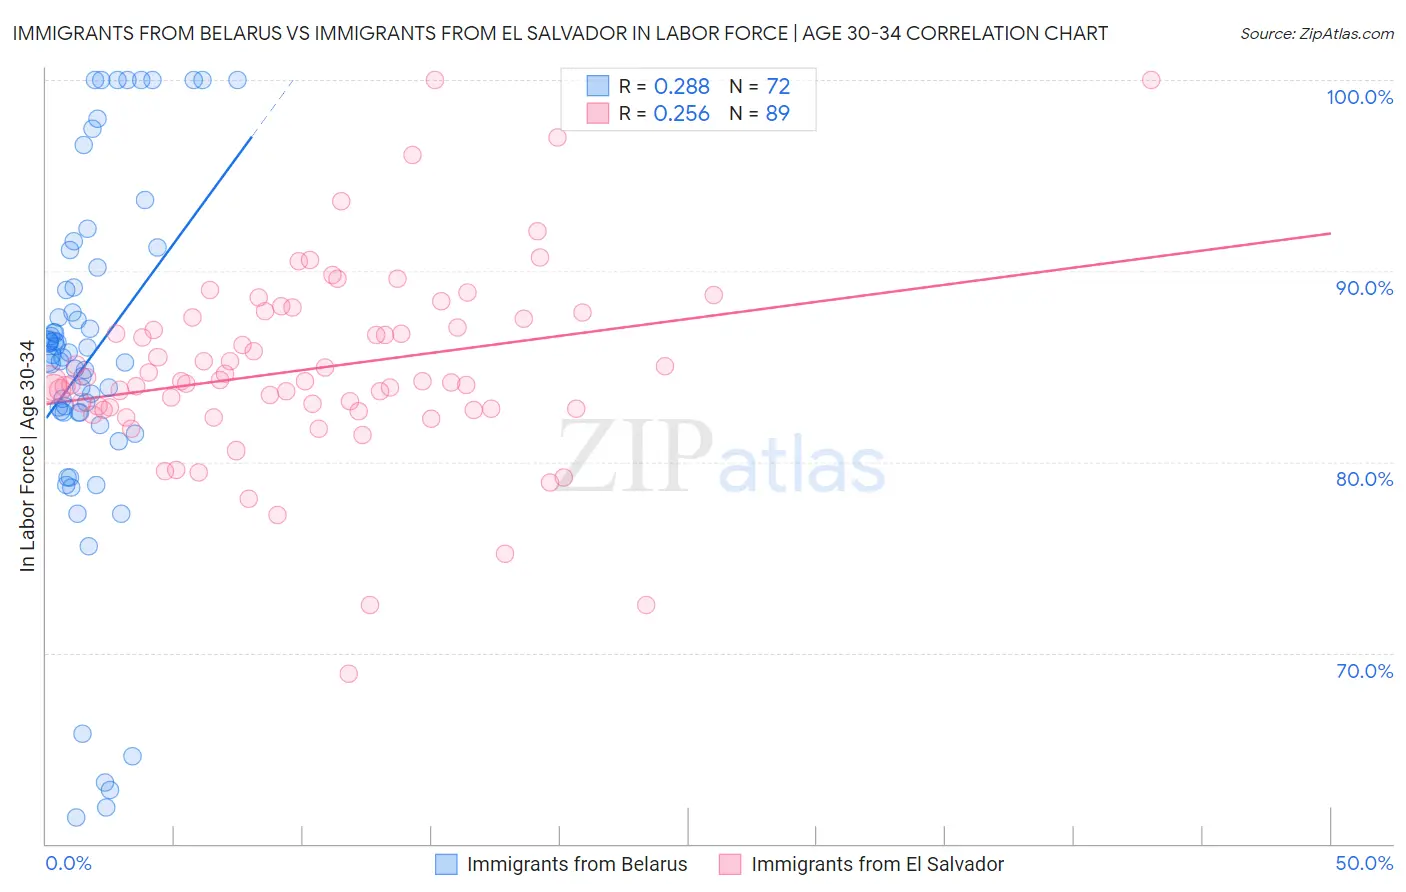
Immigrants from Belarus vs Immigrants from El Salvador In Labor Force | Age 30-34 Correlation Chart
The statistical analysis conducted on geographies consisting of 150,197,798 people shows a weak positive correlation between the proportion of Immigrants from Belarus and labor force participation rate among population between the ages 30 and 34 in the United States with a correlation coefficient (R) of 0.288 and weighted average of 85.2%. Similarly, the statistical analysis conducted on geographies consisting of 357,707,534 people shows a weak positive correlation between the proportion of Immigrants from El Salvador and labor force participation rate among population between the ages 30 and 34 in the United States with a correlation coefficient (R) of 0.256 and weighted average of 84.2%, a difference of 1.2%.
In Labor Force | Age 30-34 Correlation Summary
| Measurement | Immigrants from Belarus | Immigrants from El Salvador |
| Minimum | 61.4% | 68.9% |
| Maximum | 100.0% | 100.0% |
| Range | 38.6% | 31.1% |
| Mean | 85.4% | 84.9% |
| Median | 85.5% | 84.2% |
| Interquartile 25% (IQ1) | 82.6% | 82.8% |
| Interquartile 75% (IQ3) | 89.7% | 87.5% |
| Interquartile Range (IQR) | 7.1% | 4.8% |
| Standard Deviation (Sample) | 9.3% | 5.0% |
| Standard Deviation (Population) | 9.2% | 5.0% |
Similar Demographics by In Labor Force | Age 30-34
Demographics Similar to Immigrants from Belarus by In Labor Force | Age 30-34
In terms of in labor force | age 30-34, the demographic groups most similar to Immigrants from Belarus are Belgian (85.2%, a difference of 0.010%), Sudanese (85.2%, a difference of 0.010%), Immigrants from Austria (85.2%, a difference of 0.010%), Immigrants from Korea (85.2%, a difference of 0.020%), and Thai (85.2%, a difference of 0.020%).
| Demographics | Rating | Rank | In Labor Force | Age 30-34 |
| Swedes | 97.5 /100 | #94 | Exceptional 85.2% |
| Immigrants | India | 97.4 /100 | #95 | Exceptional 85.2% |
| Immigrants | Korea | 97.3 /100 | #96 | Exceptional 85.2% |
| Thais | 97.2 /100 | #97 | Exceptional 85.2% |
| Immigrants | Uganda | 97.2 /100 | #98 | Exceptional 85.2% |
| Belgians | 97.2 /100 | #99 | Exceptional 85.2% |
| Sudanese | 97.1 /100 | #100 | Exceptional 85.2% |
| Immigrants | Belarus | 96.9 /100 | #101 | Exceptional 85.2% |
| Immigrants | Austria | 96.8 /100 | #102 | Exceptional 85.2% |
| Ukrainians | 96.6 /100 | #103 | Exceptional 85.2% |
| Immigrants | Ghana | 96.5 /100 | #104 | Exceptional 85.2% |
| Alsatians | 96.3 /100 | #105 | Exceptional 85.2% |
| Immigrants | Middle Africa | 96.3 /100 | #106 | Exceptional 85.2% |
| Immigrants | Northern Africa | 96.3 /100 | #107 | Exceptional 85.2% |
| Immigrants | Zimbabwe | 95.8 /100 | #108 | Exceptional 85.1% |
Demographics Similar to Immigrants from El Salvador by In Labor Force | Age 30-34
In terms of in labor force | age 30-34, the demographic groups most similar to Immigrants from El Salvador are Scottish (84.2%, a difference of 0.0%), Immigrants from Cuba (84.2%, a difference of 0.0%), Immigrants from Haiti (84.2%, a difference of 0.010%), Cuban (84.2%, a difference of 0.020%), and Welsh (84.2%, a difference of 0.020%).
| Demographics | Rating | Rank | In Labor Force | Age 30-34 |
| Swiss | 5.8 /100 | #219 | Tragic 84.3% |
| Danes | 5.3 /100 | #220 | Tragic 84.3% |
| Salvadorans | 3.8 /100 | #221 | Tragic 84.2% |
| Panamanians | 3.8 /100 | #222 | Tragic 84.2% |
| Immigrants | Laos | 3.6 /100 | #223 | Tragic 84.2% |
| Cubans | 3.4 /100 | #224 | Tragic 84.2% |
| Scottish | 3.1 /100 | #225 | Tragic 84.2% |
| Immigrants | El Salvador | 3.0 /100 | #226 | Tragic 84.2% |
| Immigrants | Cuba | 3.0 /100 | #227 | Tragic 84.2% |
| Immigrants | Haiti | 2.8 /100 | #228 | Tragic 84.2% |
| Welsh | 2.7 /100 | #229 | Tragic 84.2% |
| Immigrants | Bahamas | 2.6 /100 | #230 | Tragic 84.1% |
| Malaysians | 2.2 /100 | #231 | Tragic 84.1% |
| Immigrants | Immigrants | 2.0 /100 | #232 | Tragic 84.1% |
| West Indians | 1.9 /100 | #233 | Tragic 84.1% |