Canadian vs Houma In Labor Force | Age 30-34
COMPARE
Canadian
Houma
In Labor Force | Age 30-34
In Labor Force | Age 30-34 Comparison
Canadians
Houma
84.4%
IN LABOR FORCE | AGE 30-34
15.4/ 100
METRIC RATING
203rd/ 347
METRIC RANK
79.9%
IN LABOR FORCE | AGE 30-34
0.0/ 100
METRIC RATING
331st/ 347
METRIC RANK
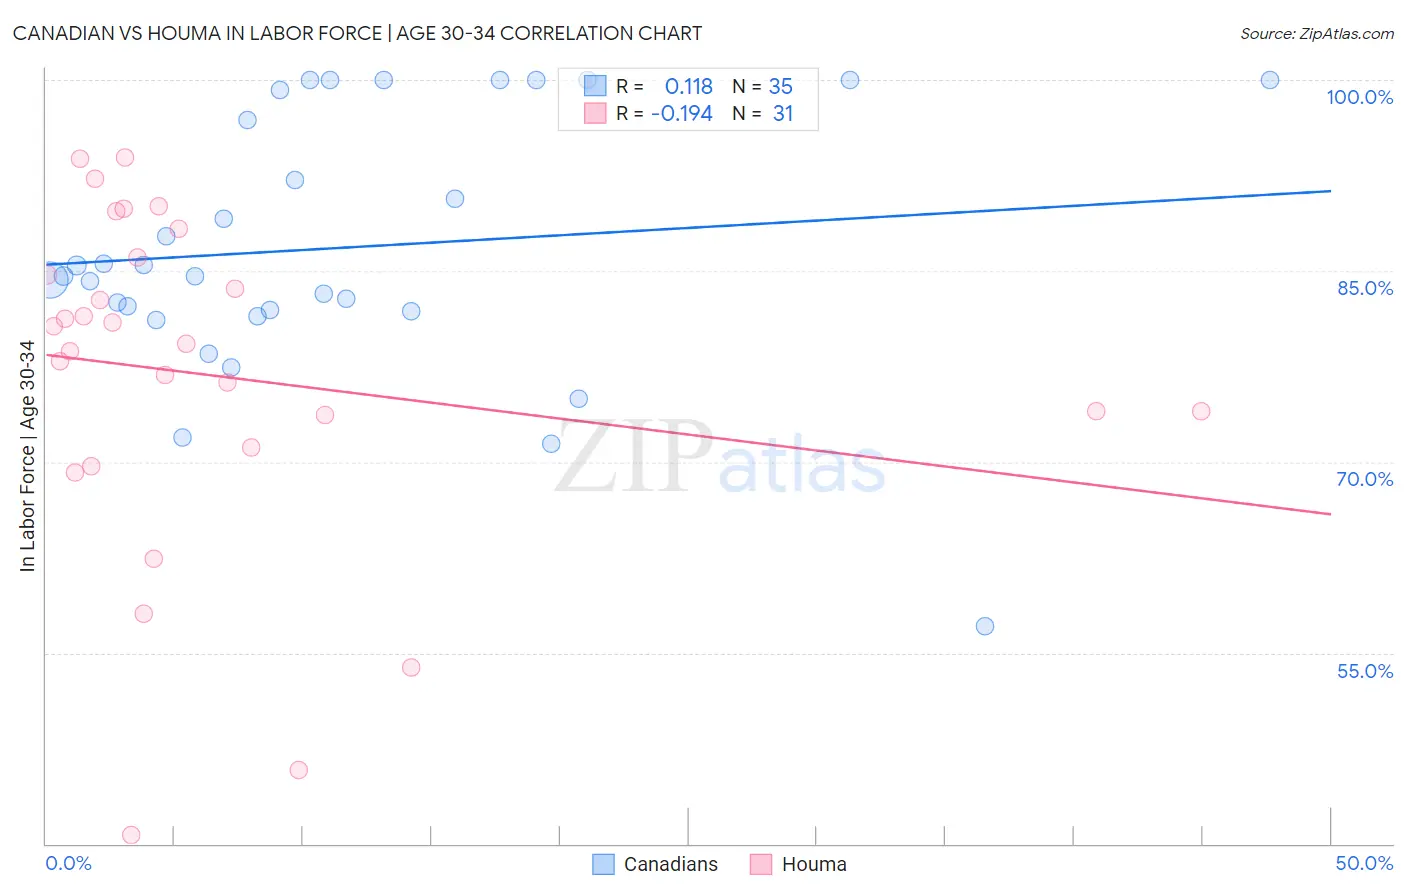
Canadian vs Houma In Labor Force | Age 30-34 Correlation Chart
The statistical analysis conducted on geographies consisting of 437,189,359 people shows a poor positive correlation between the proportion of Canadians and labor force participation rate among population between the ages 30 and 34 in the United States with a correlation coefficient (R) of 0.118 and weighted average of 84.4%. Similarly, the statistical analysis conducted on geographies consisting of 36,791,353 people shows a poor negative correlation between the proportion of Houma and labor force participation rate among population between the ages 30 and 34 in the United States with a correlation coefficient (R) of -0.194 and weighted average of 79.9%, a difference of 5.7%.
In Labor Force | Age 30-34 Correlation Summary
| Measurement | Canadian | Houma |
| Minimum | 57.1% | 40.7% |
| Maximum | 100.0% | 93.9% |
| Range | 42.9% | 53.2% |
| Mean | 86.8% | 76.8% |
| Median | 84.6% | 79.3% |
| Interquartile 25% (IQ1) | 81.9% | 71.1% |
| Interquartile 75% (IQ3) | 99.2% | 86.1% |
| Interquartile Range (IQR) | 17.3% | 15.0% |
| Standard Deviation (Sample) | 10.2% | 13.3% |
| Standard Deviation (Population) | 10.1% | 13.1% |
Similar Demographics by In Labor Force | Age 30-34
Demographics Similar to Canadians by In Labor Force | Age 30-34
In terms of in labor force | age 30-34, the demographic groups most similar to Canadians are Ecuadorian (84.4%, a difference of 0.020%), French (84.4%, a difference of 0.020%), Trinidadian and Tobagonian (84.5%, a difference of 0.030%), Immigrants from West Indies (84.5%, a difference of 0.030%), and Subsaharan African (84.5%, a difference of 0.040%).
| Demographics | Rating | Rank | In Labor Force | Age 30-34 |
| British | 22.9 /100 | #196 | Fair 84.5% |
| Immigrants | Syria | 21.9 /100 | #197 | Fair 84.5% |
| Dutch | 20.2 /100 | #198 | Fair 84.5% |
| Immigrants | Thailand | 19.1 /100 | #199 | Poor 84.5% |
| Sub-Saharan Africans | 19.0 /100 | #200 | Poor 84.5% |
| Trinidadians and Tobagonians | 18.2 /100 | #201 | Poor 84.5% |
| Immigrants | West Indies | 18.1 /100 | #202 | Poor 84.5% |
| Canadians | 15.4 /100 | #203 | Poor 84.4% |
| Ecuadorians | 14.2 /100 | #204 | Poor 84.4% |
| French | 13.8 /100 | #205 | Poor 84.4% |
| Lebanese | 10.6 /100 | #206 | Poor 84.4% |
| Bangladeshis | 9.4 /100 | #207 | Tragic 84.3% |
| Arabs | 8.9 /100 | #208 | Tragic 84.3% |
| Jamaicans | 8.8 /100 | #209 | Tragic 84.3% |
| Indonesians | 8.8 /100 | #210 | Tragic 84.3% |
Demographics Similar to Houma by In Labor Force | Age 30-34
In terms of in labor force | age 30-34, the demographic groups most similar to Houma are Kiowa (79.8%, a difference of 0.11%), Pueblo (80.0%, a difference of 0.17%), Inupiat (79.7%, a difference of 0.22%), Sioux (80.4%, a difference of 0.58%), and Creek (80.4%, a difference of 0.58%).
| Demographics | Rating | Rank | In Labor Force | Age 30-34 |
| Cheyenne | 0.0 /100 | #324 | Tragic 81.1% |
| Dutch West Indians | 0.0 /100 | #325 | Tragic 81.0% |
| Seminole | 0.0 /100 | #326 | Tragic 80.8% |
| Colville | 0.0 /100 | #327 | Tragic 80.7% |
| Sioux | 0.0 /100 | #328 | Tragic 80.4% |
| Creek | 0.0 /100 | #329 | Tragic 80.4% |
| Pueblo | 0.0 /100 | #330 | Tragic 80.0% |
| Houma | 0.0 /100 | #331 | Tragic 79.9% |
| Kiowa | 0.0 /100 | #332 | Tragic 79.8% |
| Inupiat | 0.0 /100 | #333 | Tragic 79.7% |
| Hopi | 0.0 /100 | #334 | Tragic 79.3% |
| Marshallese | 0.0 /100 | #335 | Tragic 79.2% |
| Natives/Alaskans | 0.0 /100 | #336 | Tragic 79.2% |
| Yakama | 0.0 /100 | #337 | Tragic 79.1% |
| Pima | 0.0 /100 | #338 | Tragic 79.0% |