Immigrants from Belarus vs Immigrants from Bosnia and Herzegovina In Labor Force | Age 30-34
COMPARE
Immigrants from Belarus
Immigrants from Bosnia and Herzegovina
In Labor Force | Age 30-34
In Labor Force | Age 30-34 Comparison
Immigrants from Belarus
Immigrants from Bosnia and Herzegovina
85.2%
IN LABOR FORCE | AGE 30-34
96.9/ 100
METRIC RATING
101st/ 347
METRIC RANK
85.8%
IN LABOR FORCE | AGE 30-34
99.9/ 100
METRIC RATING
33rd/ 347
METRIC RANK
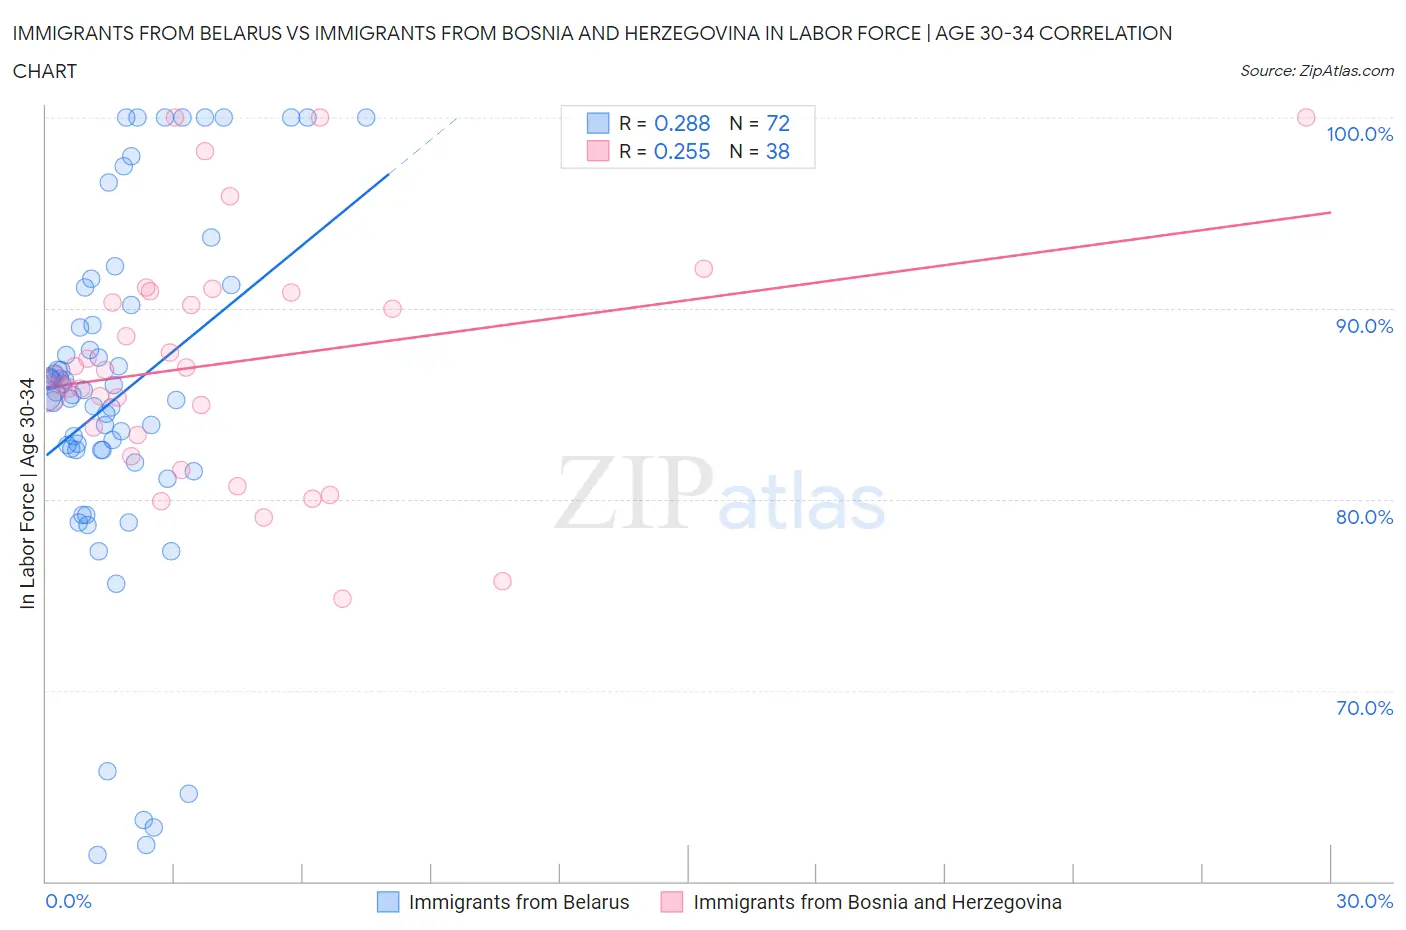
Immigrants from Belarus vs Immigrants from Bosnia and Herzegovina In Labor Force | Age 30-34 Correlation Chart
The statistical analysis conducted on geographies consisting of 150,197,798 people shows a weak positive correlation between the proportion of Immigrants from Belarus and labor force participation rate among population between the ages 30 and 34 in the United States with a correlation coefficient (R) of 0.288 and weighted average of 85.2%. Similarly, the statistical analysis conducted on geographies consisting of 156,800,912 people shows a weak positive correlation between the proportion of Immigrants from Bosnia and Herzegovina and labor force participation rate among population between the ages 30 and 34 in the United States with a correlation coefficient (R) of 0.255 and weighted average of 85.8%, a difference of 0.66%.
In Labor Force | Age 30-34 Correlation Summary
| Measurement | Immigrants from Belarus | Immigrants from Bosnia and Herzegovina |
| Minimum | 61.4% | 74.8% |
| Maximum | 100.0% | 100.0% |
| Range | 38.6% | 25.2% |
| Mean | 85.4% | 87.1% |
| Median | 85.5% | 86.6% |
| Interquartile 25% (IQ1) | 82.6% | 83.4% |
| Interquartile 75% (IQ3) | 89.7% | 90.8% |
| Interquartile Range (IQR) | 7.1% | 7.5% |
| Standard Deviation (Sample) | 9.3% | 6.3% |
| Standard Deviation (Population) | 9.2% | 6.2% |
Similar Demographics by In Labor Force | Age 30-34
Demographics Similar to Immigrants from Belarus by In Labor Force | Age 30-34
In terms of in labor force | age 30-34, the demographic groups most similar to Immigrants from Belarus are Belgian (85.2%, a difference of 0.010%), Sudanese (85.2%, a difference of 0.010%), Immigrants from Austria (85.2%, a difference of 0.010%), Immigrants from Korea (85.2%, a difference of 0.020%), and Thai (85.2%, a difference of 0.020%).
| Demographics | Rating | Rank | In Labor Force | Age 30-34 |
| Swedes | 97.5 /100 | #94 | Exceptional 85.2% |
| Immigrants | India | 97.4 /100 | #95 | Exceptional 85.2% |
| Immigrants | Korea | 97.3 /100 | #96 | Exceptional 85.2% |
| Thais | 97.2 /100 | #97 | Exceptional 85.2% |
| Immigrants | Uganda | 97.2 /100 | #98 | Exceptional 85.2% |
| Belgians | 97.2 /100 | #99 | Exceptional 85.2% |
| Sudanese | 97.1 /100 | #100 | Exceptional 85.2% |
| Immigrants | Belarus | 96.9 /100 | #101 | Exceptional 85.2% |
| Immigrants | Austria | 96.8 /100 | #102 | Exceptional 85.2% |
| Ukrainians | 96.6 /100 | #103 | Exceptional 85.2% |
| Immigrants | Ghana | 96.5 /100 | #104 | Exceptional 85.2% |
| Alsatians | 96.3 /100 | #105 | Exceptional 85.2% |
| Immigrants | Middle Africa | 96.3 /100 | #106 | Exceptional 85.2% |
| Immigrants | Northern Africa | 96.3 /100 | #107 | Exceptional 85.2% |
| Immigrants | Zimbabwe | 95.8 /100 | #108 | Exceptional 85.1% |
Demographics Similar to Immigrants from Bosnia and Herzegovina by In Labor Force | Age 30-34
In terms of in labor force | age 30-34, the demographic groups most similar to Immigrants from Bosnia and Herzegovina are Ugandan (85.8%, a difference of 0.0%), Serbian (85.8%, a difference of 0.010%), Albanian (85.7%, a difference of 0.010%), Norwegian (85.7%, a difference of 0.020%), and Immigrants from Greece (85.7%, a difference of 0.030%).
| Demographics | Rating | Rank | In Labor Force | Age 30-34 |
| Immigrants | Eastern Africa | 100.0 /100 | #26 | Exceptional 85.9% |
| Immigrants | Liberia | 100.0 /100 | #27 | Exceptional 85.9% |
| Immigrants | Latvia | 100.0 /100 | #28 | Exceptional 85.9% |
| Tsimshian | 100.0 /100 | #29 | Exceptional 85.8% |
| Immigrants | Hong Kong | 100.0 /100 | #30 | Exceptional 85.8% |
| Paraguayans | 99.9 /100 | #31 | Exceptional 85.8% |
| Cypriots | 99.9 /100 | #32 | Exceptional 85.8% |
| Immigrants | Bosnia and Herzegovina | 99.9 /100 | #33 | Exceptional 85.8% |
| Ugandans | 99.9 /100 | #34 | Exceptional 85.8% |
| Serbians | 99.9 /100 | #35 | Exceptional 85.8% |
| Albanians | 99.9 /100 | #36 | Exceptional 85.7% |
| Norwegians | 99.9 /100 | #37 | Exceptional 85.7% |
| Immigrants | Greece | 99.9 /100 | #38 | Exceptional 85.7% |
| Eastern Europeans | 99.9 /100 | #39 | Exceptional 85.7% |
| Turks | 99.9 /100 | #40 | Exceptional 85.7% |