Immigrants from Belarus vs Central American In Labor Force | Age 20-24
COMPARE
Immigrants from Belarus
Central American
In Labor Force | Age 20-24
In Labor Force | Age 20-24 Comparison
Immigrants from Belarus
Central Americans
73.0%
IN LABOR FORCE | AGE 20-24
0.1/ 100
METRIC RATING
290th/ 347
METRIC RANK
75.0%
IN LABOR FORCE | AGE 20-24
48.7/ 100
METRIC RATING
176th/ 347
METRIC RANK
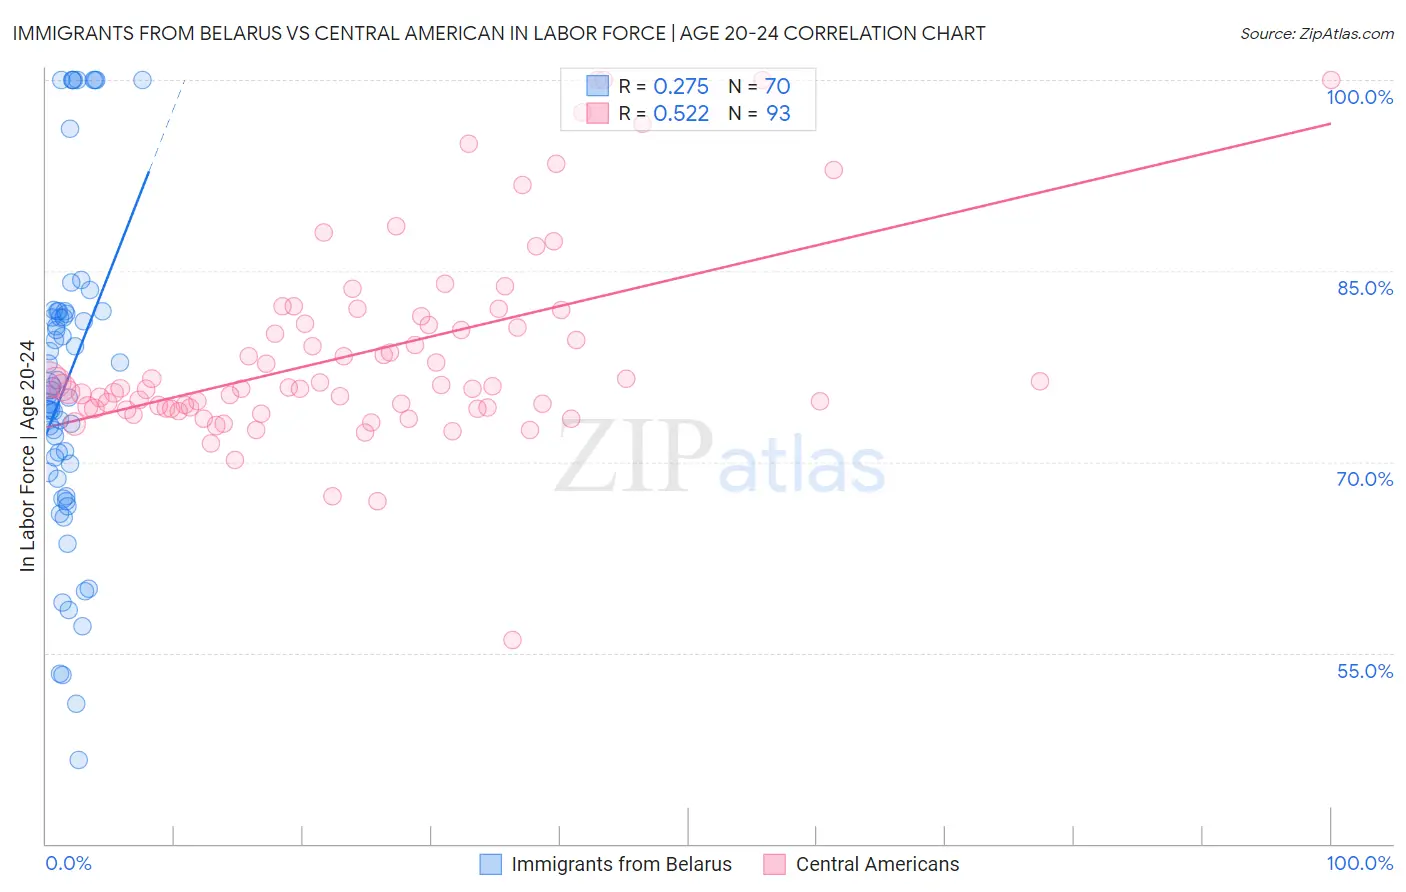
Immigrants from Belarus vs Central American In Labor Force | Age 20-24 Correlation Chart
The statistical analysis conducted on geographies consisting of 150,196,069 people shows a weak positive correlation between the proportion of Immigrants from Belarus and labor force participation rate among population between the ages 20 and 24 in the United States with a correlation coefficient (R) of 0.275 and weighted average of 73.0%. Similarly, the statistical analysis conducted on geographies consisting of 504,332,893 people shows a substantial positive correlation between the proportion of Central Americans and labor force participation rate among population between the ages 20 and 24 in the United States with a correlation coefficient (R) of 0.522 and weighted average of 75.0%, a difference of 2.8%.
In Labor Force | Age 20-24 Correlation Summary
| Measurement | Immigrants from Belarus | Central American |
| Minimum | 46.6% | 56.0% |
| Maximum | 100.0% | 100.0% |
| Range | 53.4% | 44.0% |
| Mean | 76.3% | 78.6% |
| Median | 75.4% | 75.8% |
| Interquartile 25% (IQ1) | 69.2% | 74.2% |
| Interquartile 75% (IQ3) | 81.8% | 81.1% |
| Interquartile Range (IQR) | 12.6% | 6.9% |
| Standard Deviation (Sample) | 12.7% | 7.8% |
| Standard Deviation (Population) | 12.6% | 7.8% |
Similar Demographics by In Labor Force | Age 20-24
Demographics Similar to Immigrants from Belarus by In Labor Force | Age 20-24
In terms of in labor force | age 20-24, the demographic groups most similar to Immigrants from Belarus are U.S. Virgin Islander (73.0%, a difference of 0.080%), Immigrants from Nicaragua (72.9%, a difference of 0.080%), Argentinean (73.1%, a difference of 0.11%), Pueblo (72.9%, a difference of 0.17%), and Immigrants from Korea (73.1%, a difference of 0.19%).
| Demographics | Rating | Rank | In Labor Force | Age 20-24 |
| Immigrants | Bahamas | 0.1 /100 | #283 | Tragic 73.2% |
| Kiowa | 0.1 /100 | #284 | Tragic 73.2% |
| Nicaraguans | 0.1 /100 | #285 | Tragic 73.2% |
| Immigrants | Lebanon | 0.1 /100 | #286 | Tragic 73.1% |
| Immigrants | Korea | 0.1 /100 | #287 | Tragic 73.1% |
| Argentineans | 0.1 /100 | #288 | Tragic 73.1% |
| U.S. Virgin Islanders | 0.1 /100 | #289 | Tragic 73.0% |
| Immigrants | Belarus | 0.1 /100 | #290 | Tragic 73.0% |
| Immigrants | Nicaragua | 0.0 /100 | #291 | Tragic 72.9% |
| Pueblo | 0.0 /100 | #292 | Tragic 72.9% |
| Immigrants | Belize | 0.0 /100 | #293 | Tragic 72.8% |
| Immigrants | Argentina | 0.0 /100 | #294 | Tragic 72.8% |
| Okinawans | 0.0 /100 | #295 | Tragic 72.7% |
| Jamaicans | 0.0 /100 | #296 | Tragic 72.7% |
| Central American Indians | 0.0 /100 | #297 | Tragic 72.7% |
Demographics Similar to Central Americans by In Labor Force | Age 20-24
In terms of in labor force | age 20-24, the demographic groups most similar to Central Americans are Syrian (75.0%, a difference of 0.010%), Immigrants from Mexico (75.0%, a difference of 0.010%), Immigrants from Croatia (75.1%, a difference of 0.020%), South African (75.0%, a difference of 0.020%), and Yakama (75.1%, a difference of 0.030%).
| Demographics | Rating | Rank | In Labor Force | Age 20-24 |
| Immigrants | Philippines | 55.8 /100 | #169 | Average 75.1% |
| Mexicans | 52.1 /100 | #170 | Average 75.1% |
| Cajuns | 51.1 /100 | #171 | Average 75.1% |
| Yakama | 50.8 /100 | #172 | Average 75.1% |
| Immigrants | Croatia | 50.2 /100 | #173 | Average 75.1% |
| South Africans | 50.0 /100 | #174 | Average 75.0% |
| Syrians | 49.5 /100 | #175 | Average 75.0% |
| Central Americans | 48.7 /100 | #176 | Average 75.0% |
| Immigrants | Mexico | 47.8 /100 | #177 | Average 75.0% |
| Immigrants | Central America | 45.0 /100 | #178 | Average 75.0% |
| Immigrants | Latvia | 44.1 /100 | #179 | Average 75.0% |
| Immigrants | Czechoslovakia | 44.0 /100 | #180 | Average 75.0% |
| Africans | 42.5 /100 | #181 | Average 75.0% |
| Immigrants | South Africa | 36.9 /100 | #182 | Fair 74.9% |
| Immigrants | Costa Rica | 36.7 /100 | #183 | Fair 74.9% |