Hispanic or Latino vs Houma In Labor Force | Age 20-24
COMPARE
Hispanic or Latino
Houma
In Labor Force | Age 20-24
In Labor Force | Age 20-24 Comparison
Hispanics or Latinos
Houma
74.4%
IN LABOR FORCE | AGE 20-24
7.9/ 100
METRIC RATING
223rd/ 347
METRIC RANK
73.7%
IN LABOR FORCE | AGE 20-24
0.6/ 100
METRIC RATING
261st/ 347
METRIC RANK
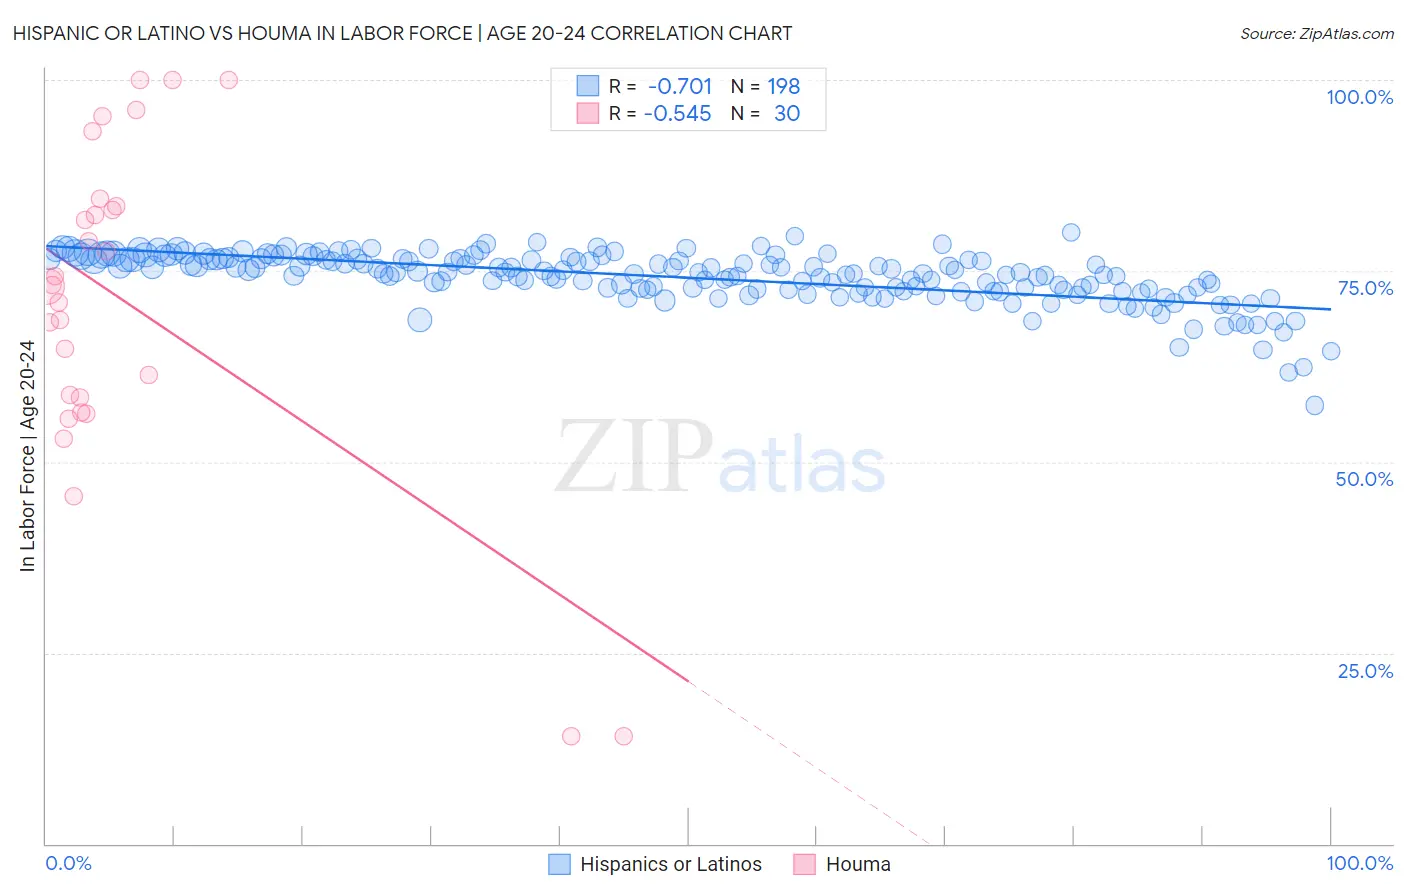
Hispanic or Latino vs Houma In Labor Force | Age 20-24 Correlation Chart
The statistical analysis conducted on geographies consisting of 573,599,041 people shows a strong negative correlation between the proportion of Hispanics or Latinos and labor force participation rate among population between the ages 20 and 24 in the United States with a correlation coefficient (R) of -0.701 and weighted average of 74.4%. Similarly, the statistical analysis conducted on geographies consisting of 36,797,175 people shows a substantial negative correlation between the proportion of Houma and labor force participation rate among population between the ages 20 and 24 in the United States with a correlation coefficient (R) of -0.545 and weighted average of 73.7%, a difference of 0.97%.
In Labor Force | Age 20-24 Correlation Summary
| Measurement | Hispanic or Latino | Houma |
| Minimum | 57.4% | 14.1% |
| Maximum | 80.0% | 100.0% |
| Range | 22.7% | 85.9% |
| Mean | 74.1% | 70.7% |
| Median | 74.8% | 73.1% |
| Interquartile 25% (IQ1) | 72.6% | 58.4% |
| Interquartile 75% (IQ3) | 76.6% | 83.5% |
| Interquartile Range (IQR) | 4.0% | 25.1% |
| Standard Deviation (Sample) | 3.4% | 21.7% |
| Standard Deviation (Population) | 3.4% | 21.3% |
Similar Demographics by In Labor Force | Age 20-24
Demographics Similar to Hispanics or Latinos by In Labor Force | Age 20-24
In terms of in labor force | age 20-24, the demographic groups most similar to Hispanics or Latinos are Seminole (74.3%, a difference of 0.060%), Immigrants from India (74.4%, a difference of 0.090%), Chickasaw (74.5%, a difference of 0.10%), Ghanaian (74.3%, a difference of 0.10%), and Immigrants from Norway (74.5%, a difference of 0.11%).
| Demographics | Rating | Rank | In Labor Force | Age 20-24 |
| Immigrants | Kuwait | 12.7 /100 | #216 | Poor 74.5% |
| Chileans | 12.5 /100 | #217 | Poor 74.5% |
| Immigrants | Peru | 10.6 /100 | #218 | Poor 74.5% |
| Nepalese | 10.5 /100 | #219 | Poor 74.5% |
| Immigrants | Norway | 10.3 /100 | #220 | Poor 74.5% |
| Chickasaw | 10.3 /100 | #221 | Poor 74.5% |
| Immigrants | India | 9.9 /100 | #222 | Tragic 74.4% |
| Hispanics or Latinos | 7.9 /100 | #223 | Tragic 74.4% |
| Seminole | 6.9 /100 | #224 | Tragic 74.3% |
| Ghanaians | 6.2 /100 | #225 | Tragic 74.3% |
| Immigrants | Fiji | 5.9 /100 | #226 | Tragic 74.3% |
| Immigrants | Ireland | 5.8 /100 | #227 | Tragic 74.3% |
| Immigrants | Ukraine | 5.1 /100 | #228 | Tragic 74.2% |
| Immigrants | Sweden | 4.6 /100 | #229 | Tragic 74.2% |
| Immigrants | Albania | 4.3 /100 | #230 | Tragic 74.2% |
Demographics Similar to Houma by In Labor Force | Age 20-24
In terms of in labor force | age 20-24, the demographic groups most similar to Houma are Immigrants from Turkey (73.7%, a difference of 0.010%), Asian (73.7%, a difference of 0.010%), Egyptian (73.7%, a difference of 0.040%), Dutch West Indian (73.7%, a difference of 0.040%), and Paraguayan (73.7%, a difference of 0.080%).
| Demographics | Rating | Rank | In Labor Force | Age 20-24 |
| Ute | 1.0 /100 | #254 | Tragic 73.8% |
| Immigrants | Pakistan | 0.9 /100 | #255 | Tragic 73.8% |
| Spanish American Indians | 0.8 /100 | #256 | Tragic 73.7% |
| Paraguayans | 0.8 /100 | #257 | Tragic 73.7% |
| Egyptians | 0.7 /100 | #258 | Tragic 73.7% |
| Dutch West Indians | 0.7 /100 | #259 | Tragic 73.7% |
| Immigrants | Turkey | 0.7 /100 | #260 | Tragic 73.7% |
| Houma | 0.6 /100 | #261 | Tragic 73.7% |
| Asians | 0.6 /100 | #262 | Tragic 73.7% |
| Immigrants | Asia | 0.5 /100 | #263 | Tragic 73.6% |
| Immigrants | Haiti | 0.5 /100 | #264 | Tragic 73.6% |
| Burmese | 0.5 /100 | #265 | Tragic 73.6% |
| Haitians | 0.5 /100 | #266 | Tragic 73.6% |
| Immigrants | Western Asia | 0.4 /100 | #267 | Tragic 73.5% |
| South Americans | 0.4 /100 | #268 | Tragic 73.5% |