Aleut vs Houma In Labor Force | Age 20-24
COMPARE
Aleut
Houma
In Labor Force | Age 20-24
In Labor Force | Age 20-24 Comparison
Aleuts
Houma
79.0%
IN LABOR FORCE | AGE 20-24
100.0/ 100
METRIC RATING
5th/ 347
METRIC RANK
73.7%
IN LABOR FORCE | AGE 20-24
0.6/ 100
METRIC RATING
261st/ 347
METRIC RANK
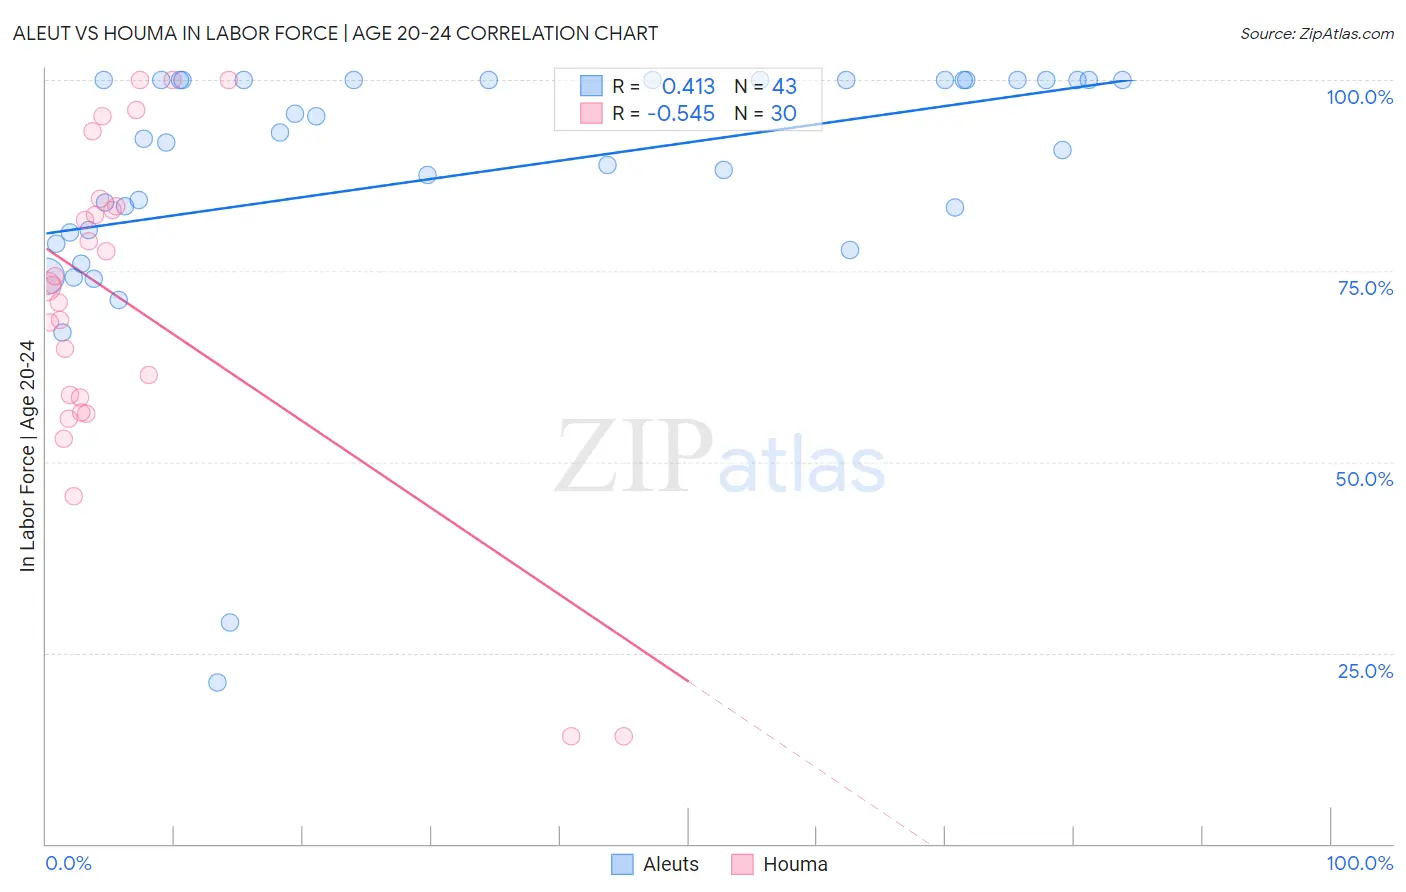
Aleut vs Houma In Labor Force | Age 20-24 Correlation Chart
The statistical analysis conducted on geographies consisting of 61,769,180 people shows a moderate positive correlation between the proportion of Aleuts and labor force participation rate among population between the ages 20 and 24 in the United States with a correlation coefficient (R) of 0.413 and weighted average of 79.0%. Similarly, the statistical analysis conducted on geographies consisting of 36,797,175 people shows a substantial negative correlation between the proportion of Houma and labor force participation rate among population between the ages 20 and 24 in the United States with a correlation coefficient (R) of -0.545 and weighted average of 73.7%, a difference of 7.2%.
In Labor Force | Age 20-24 Correlation Summary
| Measurement | Aleut | Houma |
| Minimum | 21.1% | 14.1% |
| Maximum | 100.0% | 100.0% |
| Range | 78.9% | 85.9% |
| Mean | 87.5% | 70.7% |
| Median | 92.3% | 73.1% |
| Interquartile 25% (IQ1) | 80.1% | 58.4% |
| Interquartile 75% (IQ3) | 100.0% | 83.5% |
| Interquartile Range (IQR) | 19.9% | 25.1% |
| Standard Deviation (Sample) | 17.3% | 21.7% |
| Standard Deviation (Population) | 17.1% | 21.3% |
Similar Demographics by In Labor Force | Age 20-24
Demographics Similar to Aleuts by In Labor Force | Age 20-24
In terms of in labor force | age 20-24, the demographic groups most similar to Aleuts are Danish (79.0%, a difference of 0.010%), Luxembourger (79.0%, a difference of 0.050%), Alaskan Athabascan (79.1%, a difference of 0.14%), Immigrants from Cabo Verde (78.9%, a difference of 0.16%), and Swedish (78.8%, a difference of 0.22%).
| Demographics | Rating | Rank | In Labor Force | Age 20-24 |
| Norwegians | 100.0 /100 | #1 | Exceptional 80.1% |
| Immigrants | Somalia | 100.0 /100 | #2 | Exceptional 79.5% |
| Somalis | 100.0 /100 | #3 | Exceptional 79.3% |
| Alaskan Athabascans | 100.0 /100 | #4 | Exceptional 79.1% |
| Aleuts | 100.0 /100 | #5 | Exceptional 79.0% |
| Danes | 100.0 /100 | #6 | Exceptional 79.0% |
| Luxembourgers | 100.0 /100 | #7 | Exceptional 79.0% |
| Immigrants | Cabo Verde | 100.0 /100 | #8 | Exceptional 78.9% |
| Swedes | 100.0 /100 | #9 | Exceptional 78.8% |
| Slovenes | 100.0 /100 | #10 | Exceptional 78.7% |
| Finns | 100.0 /100 | #11 | Exceptional 78.7% |
| Germans | 100.0 /100 | #12 | Exceptional 78.6% |
| Scandinavians | 100.0 /100 | #13 | Exceptional 78.5% |
| Czechs | 100.0 /100 | #14 | Exceptional 78.5% |
| Sudanese | 100.0 /100 | #15 | Exceptional 78.4% |
Demographics Similar to Houma by In Labor Force | Age 20-24
In terms of in labor force | age 20-24, the demographic groups most similar to Houma are Immigrants from Turkey (73.7%, a difference of 0.010%), Asian (73.7%, a difference of 0.010%), Egyptian (73.7%, a difference of 0.040%), Dutch West Indian (73.7%, a difference of 0.040%), and Paraguayan (73.7%, a difference of 0.080%).
| Demographics | Rating | Rank | In Labor Force | Age 20-24 |
| Ute | 1.0 /100 | #254 | Tragic 73.8% |
| Immigrants | Pakistan | 0.9 /100 | #255 | Tragic 73.8% |
| Spanish American Indians | 0.8 /100 | #256 | Tragic 73.7% |
| Paraguayans | 0.8 /100 | #257 | Tragic 73.7% |
| Egyptians | 0.7 /100 | #258 | Tragic 73.7% |
| Dutch West Indians | 0.7 /100 | #259 | Tragic 73.7% |
| Immigrants | Turkey | 0.7 /100 | #260 | Tragic 73.7% |
| Houma | 0.6 /100 | #261 | Tragic 73.7% |
| Asians | 0.6 /100 | #262 | Tragic 73.7% |
| Immigrants | Asia | 0.5 /100 | #263 | Tragic 73.6% |
| Immigrants | Haiti | 0.5 /100 | #264 | Tragic 73.6% |
| Burmese | 0.5 /100 | #265 | Tragic 73.6% |
| Haitians | 0.5 /100 | #266 | Tragic 73.6% |
| Immigrants | Western Asia | 0.4 /100 | #267 | Tragic 73.5% |
| South Americans | 0.4 /100 | #268 | Tragic 73.5% |