Immigrants from Belarus vs Immigrants from Portugal In Labor Force | Age 20-24
COMPARE
Immigrants from Belarus
Immigrants from Portugal
In Labor Force | Age 20-24
In Labor Force | Age 20-24 Comparison
Immigrants from Belarus
Immigrants from Portugal
73.0%
IN LABOR FORCE | AGE 20-24
0.1/ 100
METRIC RATING
290th/ 347
METRIC RANK
75.8%
IN LABOR FORCE | AGE 20-24
94.8/ 100
METRIC RATING
119th/ 347
METRIC RANK
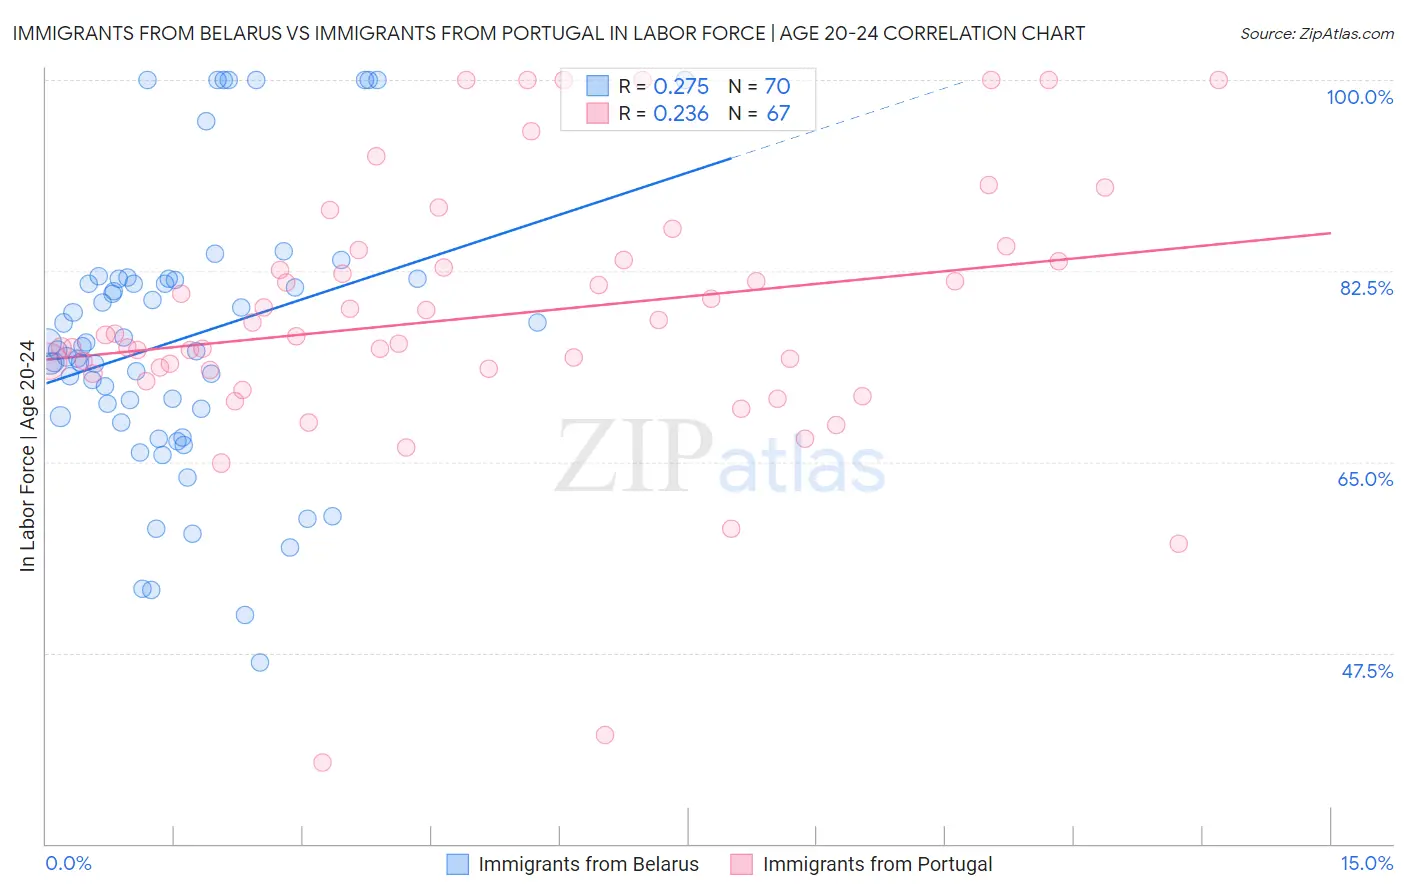
Immigrants from Belarus vs Immigrants from Portugal In Labor Force | Age 20-24 Correlation Chart
The statistical analysis conducted on geographies consisting of 150,196,069 people shows a weak positive correlation between the proportion of Immigrants from Belarus and labor force participation rate among population between the ages 20 and 24 in the United States with a correlation coefficient (R) of 0.275 and weighted average of 73.0%. Similarly, the statistical analysis conducted on geographies consisting of 174,703,744 people shows a weak positive correlation between the proportion of Immigrants from Portugal and labor force participation rate among population between the ages 20 and 24 in the United States with a correlation coefficient (R) of 0.236 and weighted average of 75.8%, a difference of 3.9%.
In Labor Force | Age 20-24 Correlation Summary
| Measurement | Immigrants from Belarus | Immigrants from Portugal |
| Minimum | 46.6% | 37.5% |
| Maximum | 100.0% | 100.0% |
| Range | 53.4% | 62.5% |
| Mean | 76.3% | 78.3% |
| Median | 75.4% | 76.6% |
| Interquartile 25% (IQ1) | 69.2% | 73.5% |
| Interquartile 75% (IQ3) | 81.8% | 83.6% |
| Interquartile Range (IQR) | 12.6% | 10.1% |
| Standard Deviation (Sample) | 12.7% | 12.1% |
| Standard Deviation (Population) | 12.6% | 12.1% |
Similar Demographics by In Labor Force | Age 20-24
Demographics Similar to Immigrants from Belarus by In Labor Force | Age 20-24
In terms of in labor force | age 20-24, the demographic groups most similar to Immigrants from Belarus are U.S. Virgin Islander (73.0%, a difference of 0.080%), Immigrants from Nicaragua (72.9%, a difference of 0.080%), Argentinean (73.1%, a difference of 0.11%), Pueblo (72.9%, a difference of 0.17%), and Immigrants from Korea (73.1%, a difference of 0.19%).
| Demographics | Rating | Rank | In Labor Force | Age 20-24 |
| Immigrants | Bahamas | 0.1 /100 | #283 | Tragic 73.2% |
| Kiowa | 0.1 /100 | #284 | Tragic 73.2% |
| Nicaraguans | 0.1 /100 | #285 | Tragic 73.2% |
| Immigrants | Lebanon | 0.1 /100 | #286 | Tragic 73.1% |
| Immigrants | Korea | 0.1 /100 | #287 | Tragic 73.1% |
| Argentineans | 0.1 /100 | #288 | Tragic 73.1% |
| U.S. Virgin Islanders | 0.1 /100 | #289 | Tragic 73.0% |
| Immigrants | Belarus | 0.1 /100 | #290 | Tragic 73.0% |
| Immigrants | Nicaragua | 0.0 /100 | #291 | Tragic 72.9% |
| Pueblo | 0.0 /100 | #292 | Tragic 72.9% |
| Immigrants | Belize | 0.0 /100 | #293 | Tragic 72.8% |
| Immigrants | Argentina | 0.0 /100 | #294 | Tragic 72.8% |
| Okinawans | 0.0 /100 | #295 | Tragic 72.7% |
| Jamaicans | 0.0 /100 | #296 | Tragic 72.7% |
| Central American Indians | 0.0 /100 | #297 | Tragic 72.7% |
Demographics Similar to Immigrants from Portugal by In Labor Force | Age 20-24
In terms of in labor force | age 20-24, the demographic groups most similar to Immigrants from Portugal are Spanish American (75.8%, a difference of 0.0%), Immigrants from North America (75.9%, a difference of 0.010%), Assyrian/Chaldean/Syriac (75.9%, a difference of 0.010%), Immigrants from Africa (75.8%, a difference of 0.010%), and Immigrants from Zimbabwe (75.9%, a difference of 0.020%).
| Demographics | Rating | Rank | In Labor Force | Age 20-24 |
| Immigrants | Canada | 95.6 /100 | #112 | Exceptional 75.9% |
| Immigrants | Netherlands | 95.3 /100 | #113 | Exceptional 75.9% |
| Immigrants | Zimbabwe | 95.1 /100 | #114 | Exceptional 75.9% |
| Alaska Natives | 95.1 /100 | #115 | Exceptional 75.9% |
| Immigrants | North America | 95.0 /100 | #116 | Exceptional 75.9% |
| Assyrians/Chaldeans/Syriacs | 94.9 /100 | #117 | Exceptional 75.9% |
| Spanish Americans | 94.8 /100 | #118 | Exceptional 75.8% |
| Immigrants | Portugal | 94.8 /100 | #119 | Exceptional 75.8% |
| Immigrants | Africa | 94.6 /100 | #120 | Exceptional 75.8% |
| Immigrants | Serbia | 94.3 /100 | #121 | Exceptional 75.8% |
| Pakistanis | 94.1 /100 | #122 | Exceptional 75.8% |
| Immigrants | Bulgaria | 94.1 /100 | #123 | Exceptional 75.8% |
| Immigrants | Sierra Leone | 93.8 /100 | #124 | Exceptional 75.8% |
| Immigrants | Scotland | 93.7 /100 | #125 | Exceptional 75.8% |
| Brazilians | 93.0 /100 | #126 | Exceptional 75.8% |