Hungarian vs Houma In Labor Force | Age 20-24
COMPARE
Hungarian
Houma
In Labor Force | Age 20-24
In Labor Force | Age 20-24 Comparison
Hungarians
Houma
76.3%
IN LABOR FORCE | AGE 20-24
98.9/ 100
METRIC RATING
93rd/ 347
METRIC RANK
73.7%
IN LABOR FORCE | AGE 20-24
0.6/ 100
METRIC RATING
261st/ 347
METRIC RANK
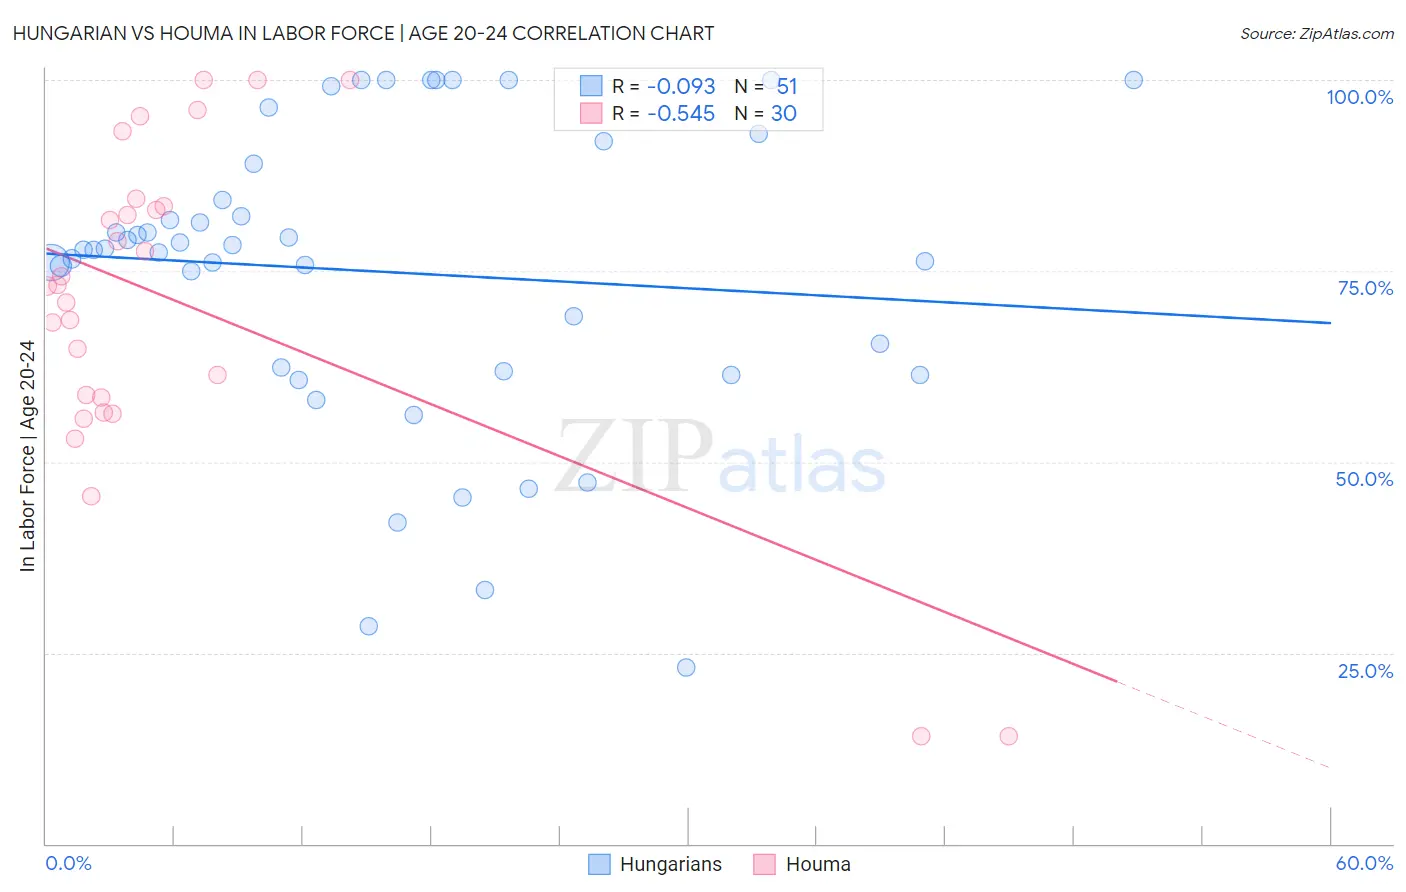
Hungarian vs Houma In Labor Force | Age 20-24 Correlation Chart
The statistical analysis conducted on geographies consisting of 485,725,263 people shows a slight negative correlation between the proportion of Hungarians and labor force participation rate among population between the ages 20 and 24 in the United States with a correlation coefficient (R) of -0.093 and weighted average of 76.3%. Similarly, the statistical analysis conducted on geographies consisting of 36,797,175 people shows a substantial negative correlation between the proportion of Houma and labor force participation rate among population between the ages 20 and 24 in the United States with a correlation coefficient (R) of -0.545 and weighted average of 73.7%, a difference of 3.6%.
In Labor Force | Age 20-24 Correlation Summary
| Measurement | Hungarian | Houma |
| Minimum | 23.1% | 14.1% |
| Maximum | 100.0% | 100.0% |
| Range | 76.9% | 85.9% |
| Mean | 74.9% | 70.7% |
| Median | 77.8% | 73.1% |
| Interquartile 25% (IQ1) | 61.9% | 58.4% |
| Interquartile 75% (IQ3) | 89.1% | 83.5% |
| Interquartile Range (IQR) | 27.2% | 25.1% |
| Standard Deviation (Sample) | 19.5% | 21.7% |
| Standard Deviation (Population) | 19.3% | 21.3% |
Similar Demographics by In Labor Force | Age 20-24
Demographics Similar to Hungarians by In Labor Force | Age 20-24
In terms of in labor force | age 20-24, the demographic groups most similar to Hungarians are Maltese (76.3%, a difference of 0.020%), Sierra Leonean (76.3%, a difference of 0.050%), Immigrants from Burma/Myanmar (76.3%, a difference of 0.070%), Potawatomi (76.2%, a difference of 0.090%), and Immigrants from Germany (76.2%, a difference of 0.10%).
| Demographics | Rating | Rank | In Labor Force | Age 20-24 |
| Immigrants | Iraq | 99.3 /100 | #86 | Exceptional 76.4% |
| Immigrants | Thailand | 99.3 /100 | #87 | Exceptional 76.4% |
| Spanish | 99.2 /100 | #88 | Exceptional 76.4% |
| Bulgarians | 99.2 /100 | #89 | Exceptional 76.4% |
| Immigrants | Burma/Myanmar | 99.1 /100 | #90 | Exceptional 76.3% |
| Sierra Leoneans | 99.0 /100 | #91 | Exceptional 76.3% |
| Maltese | 98.9 /100 | #92 | Exceptional 76.3% |
| Hungarians | 98.9 /100 | #93 | Exceptional 76.3% |
| Potawatomi | 98.5 /100 | #94 | Exceptional 76.2% |
| Immigrants | Germany | 98.5 /100 | #95 | Exceptional 76.2% |
| Immigrants | Nonimmigrants | 98.5 /100 | #96 | Exceptional 76.2% |
| Immigrants | Lithuania | 98.0 /100 | #97 | Exceptional 76.1% |
| Immigrants | Oceania | 98.0 /100 | #98 | Exceptional 76.1% |
| Americans | 97.8 /100 | #99 | Exceptional 76.1% |
| Shoshone | 97.8 /100 | #100 | Exceptional 76.1% |
Demographics Similar to Houma by In Labor Force | Age 20-24
In terms of in labor force | age 20-24, the demographic groups most similar to Houma are Immigrants from Turkey (73.7%, a difference of 0.010%), Asian (73.7%, a difference of 0.010%), Egyptian (73.7%, a difference of 0.040%), Dutch West Indian (73.7%, a difference of 0.040%), and Paraguayan (73.7%, a difference of 0.080%).
| Demographics | Rating | Rank | In Labor Force | Age 20-24 |
| Ute | 1.0 /100 | #254 | Tragic 73.8% |
| Immigrants | Pakistan | 0.9 /100 | #255 | Tragic 73.8% |
| Spanish American Indians | 0.8 /100 | #256 | Tragic 73.7% |
| Paraguayans | 0.8 /100 | #257 | Tragic 73.7% |
| Egyptians | 0.7 /100 | #258 | Tragic 73.7% |
| Dutch West Indians | 0.7 /100 | #259 | Tragic 73.7% |
| Immigrants | Turkey | 0.7 /100 | #260 | Tragic 73.7% |
| Houma | 0.6 /100 | #261 | Tragic 73.7% |
| Asians | 0.6 /100 | #262 | Tragic 73.7% |
| Immigrants | Asia | 0.5 /100 | #263 | Tragic 73.6% |
| Immigrants | Haiti | 0.5 /100 | #264 | Tragic 73.6% |
| Burmese | 0.5 /100 | #265 | Tragic 73.6% |
| Haitians | 0.5 /100 | #266 | Tragic 73.6% |
| Immigrants | Western Asia | 0.4 /100 | #267 | Tragic 73.5% |
| South Americans | 0.4 /100 | #268 | Tragic 73.5% |