Immigrants from Belarus vs Icelander In Labor Force | Age 20-24
COMPARE
Immigrants from Belarus
Icelander
In Labor Force | Age 20-24
In Labor Force | Age 20-24 Comparison
Immigrants from Belarus
Icelanders
73.0%
IN LABOR FORCE | AGE 20-24
0.1/ 100
METRIC RATING
290th/ 347
METRIC RANK
76.9%
IN LABOR FORCE | AGE 20-24
99.9/ 100
METRIC RATING
66th/ 347
METRIC RANK
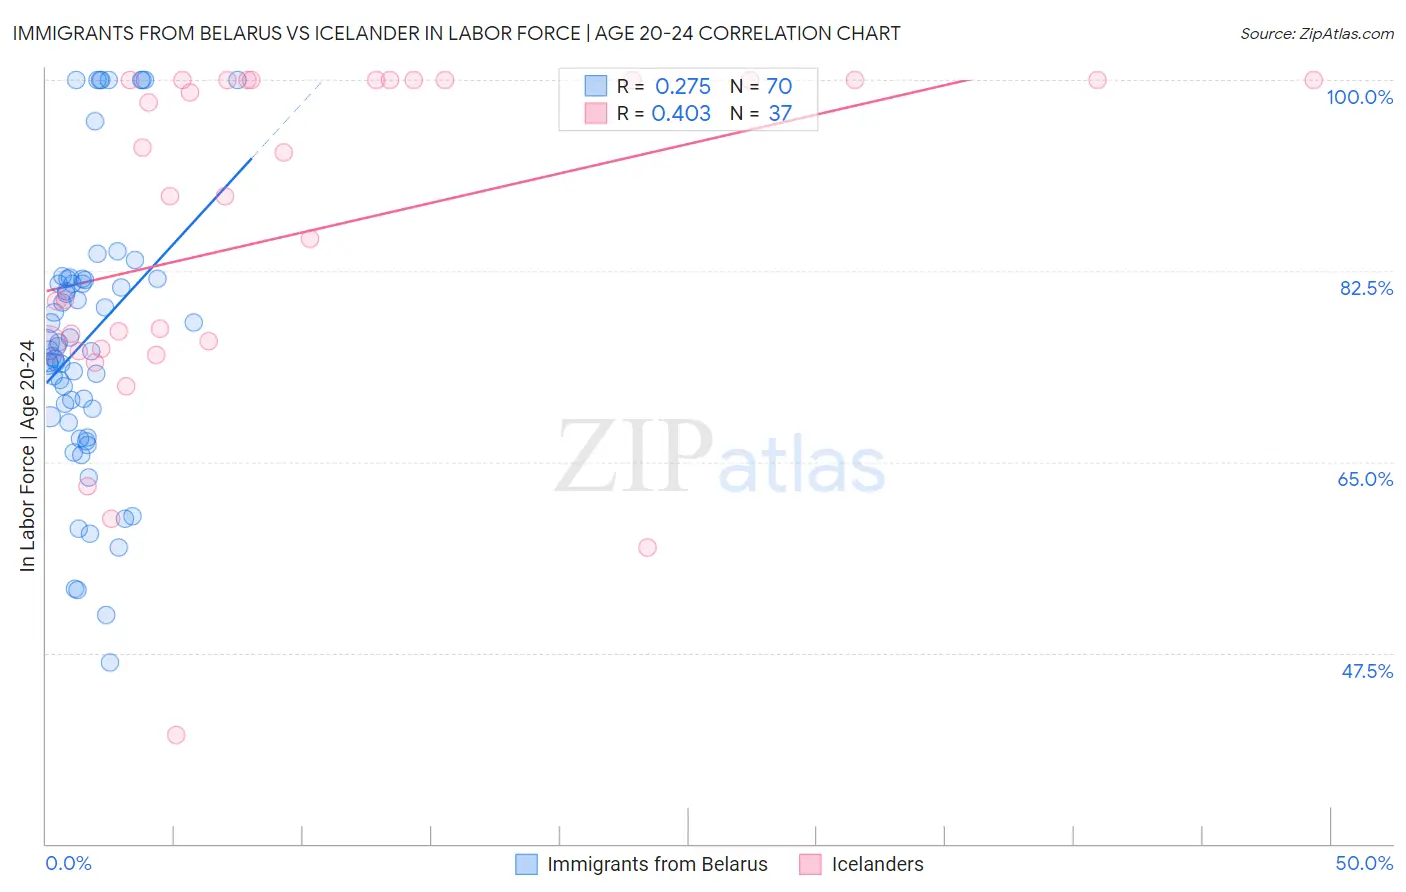
Immigrants from Belarus vs Icelander In Labor Force | Age 20-24 Correlation Chart
The statistical analysis conducted on geographies consisting of 150,196,069 people shows a weak positive correlation between the proportion of Immigrants from Belarus and labor force participation rate among population between the ages 20 and 24 in the United States with a correlation coefficient (R) of 0.275 and weighted average of 73.0%. Similarly, the statistical analysis conducted on geographies consisting of 159,597,296 people shows a moderate positive correlation between the proportion of Icelanders and labor force participation rate among population between the ages 20 and 24 in the United States with a correlation coefficient (R) of 0.403 and weighted average of 76.9%, a difference of 5.3%.
In Labor Force | Age 20-24 Correlation Summary
| Measurement | Immigrants from Belarus | Icelander |
| Minimum | 46.6% | 40.0% |
| Maximum | 100.0% | 100.0% |
| Range | 53.4% | 60.0% |
| Mean | 76.3% | 86.0% |
| Median | 75.4% | 89.3% |
| Interquartile 25% (IQ1) | 69.2% | 75.6% |
| Interquartile 75% (IQ3) | 81.8% | 100.0% |
| Interquartile Range (IQR) | 12.6% | 24.4% |
| Standard Deviation (Sample) | 12.7% | 15.4% |
| Standard Deviation (Population) | 12.6% | 15.2% |
Similar Demographics by In Labor Force | Age 20-24
Demographics Similar to Immigrants from Belarus by In Labor Force | Age 20-24
In terms of in labor force | age 20-24, the demographic groups most similar to Immigrants from Belarus are U.S. Virgin Islander (73.0%, a difference of 0.080%), Immigrants from Nicaragua (72.9%, a difference of 0.080%), Argentinean (73.1%, a difference of 0.11%), Pueblo (72.9%, a difference of 0.17%), and Immigrants from Korea (73.1%, a difference of 0.19%).
| Demographics | Rating | Rank | In Labor Force | Age 20-24 |
| Immigrants | Bahamas | 0.1 /100 | #283 | Tragic 73.2% |
| Kiowa | 0.1 /100 | #284 | Tragic 73.2% |
| Nicaraguans | 0.1 /100 | #285 | Tragic 73.2% |
| Immigrants | Lebanon | 0.1 /100 | #286 | Tragic 73.1% |
| Immigrants | Korea | 0.1 /100 | #287 | Tragic 73.1% |
| Argentineans | 0.1 /100 | #288 | Tragic 73.1% |
| U.S. Virgin Islanders | 0.1 /100 | #289 | Tragic 73.0% |
| Immigrants | Belarus | 0.1 /100 | #290 | Tragic 73.0% |
| Immigrants | Nicaragua | 0.0 /100 | #291 | Tragic 72.9% |
| Pueblo | 0.0 /100 | #292 | Tragic 72.9% |
| Immigrants | Belize | 0.0 /100 | #293 | Tragic 72.8% |
| Immigrants | Argentina | 0.0 /100 | #294 | Tragic 72.8% |
| Okinawans | 0.0 /100 | #295 | Tragic 72.7% |
| Jamaicans | 0.0 /100 | #296 | Tragic 72.7% |
| Central American Indians | 0.0 /100 | #297 | Tragic 72.7% |
Demographics Similar to Icelanders by In Labor Force | Age 20-24
In terms of in labor force | age 20-24, the demographic groups most similar to Icelanders are Slavic (76.9%, a difference of 0.010%), Crow (76.9%, a difference of 0.020%), French American Indian (76.8%, a difference of 0.040%), Immigrants from Sudan (76.8%, a difference of 0.060%), and White/Caucasian (76.9%, a difference of 0.070%).
| Demographics | Rating | Rank | In Labor Force | Age 20-24 |
| Scotch-Irish | 99.9 /100 | #59 | Exceptional 77.0% |
| Kenyans | 99.9 /100 | #60 | Exceptional 77.0% |
| Immigrants | Eritrea | 99.9 /100 | #61 | Exceptional 77.0% |
| Immigrants | Kenya | 99.9 /100 | #62 | Exceptional 77.0% |
| Lithuanians | 99.9 /100 | #63 | Exceptional 77.0% |
| Whites/Caucasians | 99.9 /100 | #64 | Exceptional 76.9% |
| Crow | 99.9 /100 | #65 | Exceptional 76.9% |
| Icelanders | 99.9 /100 | #66 | Exceptional 76.9% |
| Slavs | 99.9 /100 | #67 | Exceptional 76.9% |
| French American Indians | 99.8 /100 | #68 | Exceptional 76.8% |
| Immigrants | Sudan | 99.8 /100 | #69 | Exceptional 76.8% |
| Ottawa | 99.8 /100 | #70 | Exceptional 76.8% |
| Northern Europeans | 99.8 /100 | #71 | Exceptional 76.8% |
| Guamanians/Chamorros | 99.8 /100 | #72 | Exceptional 76.7% |
| British | 99.8 /100 | #73 | Exceptional 76.7% |