Immigrants from Barbados vs Ute In Labor Force | Age 16-19
COMPARE
Immigrants from Barbados
Ute
In Labor Force | Age 16-19
In Labor Force | Age 16-19 Comparison
Immigrants from Barbados
Ute
29.0%
IN LABOR FORCE | AGE 16-19
0.0/ 100
METRIC RATING
342nd/ 347
METRIC RANK
37.1%
IN LABOR FORCE | AGE 16-19
75.7/ 100
METRIC RATING
158th/ 347
METRIC RANK
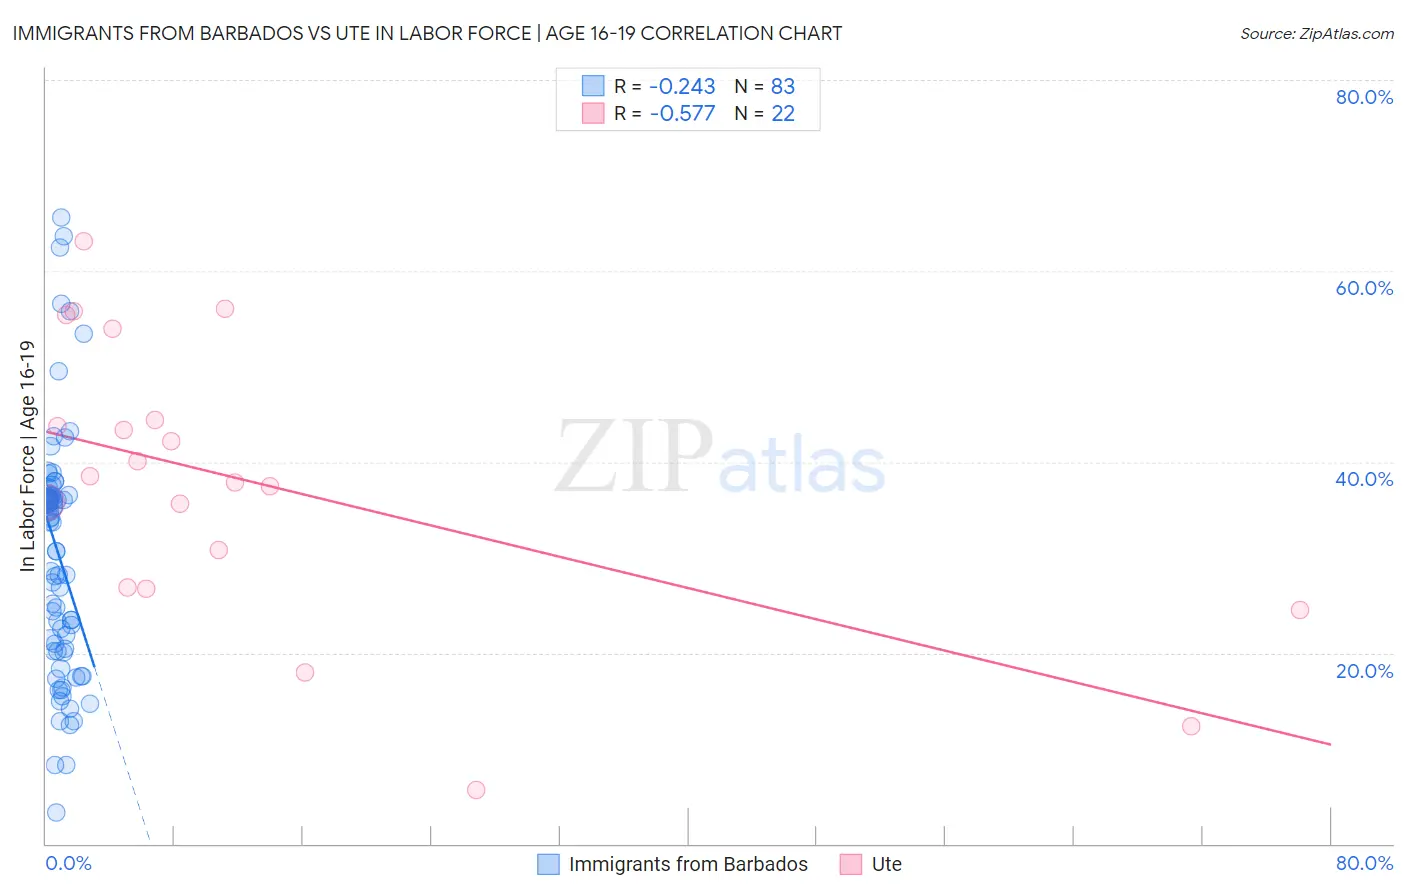
Immigrants from Barbados vs Ute In Labor Force | Age 16-19 Correlation Chart
The statistical analysis conducted on geographies consisting of 112,727,809 people shows a weak negative correlation between the proportion of Immigrants from Barbados and labor force participation rate among population between the ages 16 and 19 in the United States with a correlation coefficient (R) of -0.243 and weighted average of 29.0%. Similarly, the statistical analysis conducted on geographies consisting of 55,645,372 people shows a substantial negative correlation between the proportion of Ute and labor force participation rate among population between the ages 16 and 19 in the United States with a correlation coefficient (R) of -0.577 and weighted average of 37.1%, a difference of 28.0%.
In Labor Force | Age 16-19 Correlation Summary
| Measurement | Immigrants from Barbados | Ute |
| Minimum | 3.3% | 5.6% |
| Maximum | 65.6% | 63.1% |
| Range | 62.3% | 57.5% |
| Mean | 30.3% | 37.6% |
| Median | 33.7% | 38.1% |
| Interquartile 25% (IQ1) | 20.2% | 26.8% |
| Interquartile 75% (IQ3) | 36.5% | 44.4% |
| Interquartile Range (IQR) | 16.3% | 17.6% |
| Standard Deviation (Sample) | 12.8% | 14.7% |
| Standard Deviation (Population) | 12.7% | 14.4% |
Similar Demographics by In Labor Force | Age 16-19
Demographics Similar to Immigrants from Barbados by In Labor Force | Age 16-19
In terms of in labor force | age 16-19, the demographic groups most similar to Immigrants from Barbados are Immigrants from Armenia (29.0%, a difference of 0.15%), British West Indian (29.1%, a difference of 0.38%), Immigrants from Uzbekistan (29.2%, a difference of 0.58%), Vietnamese (29.6%, a difference of 2.0%), and Immigrants from Bangladesh (30.0%, a difference of 3.7%).
| Demographics | Rating | Rank | In Labor Force | Age 16-19 |
| Immigrants | Hong Kong | 0.0 /100 | #333 | Tragic 30.5% |
| Puerto Ricans | 0.0 /100 | #334 | Tragic 30.3% |
| Immigrants | Cuba | 0.0 /100 | #335 | Tragic 30.2% |
| Immigrants | Trinidad and Tobago | 0.0 /100 | #336 | Tragic 30.2% |
| Immigrants | Bangladesh | 0.0 /100 | #337 | Tragic 30.0% |
| Vietnamese | 0.0 /100 | #338 | Tragic 29.6% |
| Immigrants | Uzbekistan | 0.0 /100 | #339 | Tragic 29.2% |
| British West Indians | 0.0 /100 | #340 | Tragic 29.1% |
| Immigrants | Armenia | 0.0 /100 | #341 | Tragic 29.0% |
| Immigrants | Barbados | 0.0 /100 | #342 | Tragic 29.0% |
| Yuman | 0.0 /100 | #343 | Tragic 27.7% |
| Guyanese | 0.0 /100 | #344 | Tragic 27.4% |
| Immigrants | Guyana | 0.0 /100 | #345 | Tragic 27.3% |
| Immigrants | St. Vincent and the Grenadines | 0.0 /100 | #346 | Tragic 26.3% |
| Immigrants | Grenada | 0.0 /100 | #347 | Tragic 25.4% |
Demographics Similar to Ute by In Labor Force | Age 16-19
In terms of in labor force | age 16-19, the demographic groups most similar to Ute are Immigrants from Brazil (37.1%, a difference of 0.050%), Yaqui (37.1%, a difference of 0.080%), Immigrants from Saudi Arabia (37.0%, a difference of 0.12%), Cambodian (37.0%, a difference of 0.27%), and Kiowa (37.2%, a difference of 0.34%).
| Demographics | Rating | Rank | In Labor Force | Age 16-19 |
| Immigrants | Poland | 84.4 /100 | #151 | Excellent 37.3% |
| Immigrants | Sierra Leone | 83.6 /100 | #152 | Excellent 37.3% |
| Arapaho | 81.8 /100 | #153 | Excellent 37.3% |
| Immigrants | Bulgaria | 81.6 /100 | #154 | Excellent 37.3% |
| Immigrants | Lithuania | 80.7 /100 | #155 | Excellent 37.2% |
| Kiowa | 80.4 /100 | #156 | Excellent 37.2% |
| Immigrants | Brazil | 76.5 /100 | #157 | Good 37.1% |
| Ute | 75.7 /100 | #158 | Good 37.1% |
| Yaqui | 74.4 /100 | #159 | Good 37.1% |
| Immigrants | Saudi Arabia | 73.9 /100 | #160 | Good 37.0% |
| Cambodians | 71.5 /100 | #161 | Good 37.0% |
| Immigrants | Jordan | 69.5 /100 | #162 | Good 36.9% |
| Bermudans | 69.3 /100 | #163 | Good 36.9% |
| Immigrants | Kuwait | 68.9 /100 | #164 | Good 36.9% |
| Yakama | 66.9 /100 | #165 | Good 36.9% |