Uruguayan vs Ute In Labor Force | Age 16-19
COMPARE
Uruguayan
Ute
In Labor Force | Age 16-19
In Labor Force | Age 16-19 Comparison
Uruguayans
Ute
34.9%
IN LABOR FORCE | AGE 16-19
2.6/ 100
METRIC RATING
242nd/ 347
METRIC RANK
37.1%
IN LABOR FORCE | AGE 16-19
75.7/ 100
METRIC RATING
158th/ 347
METRIC RANK
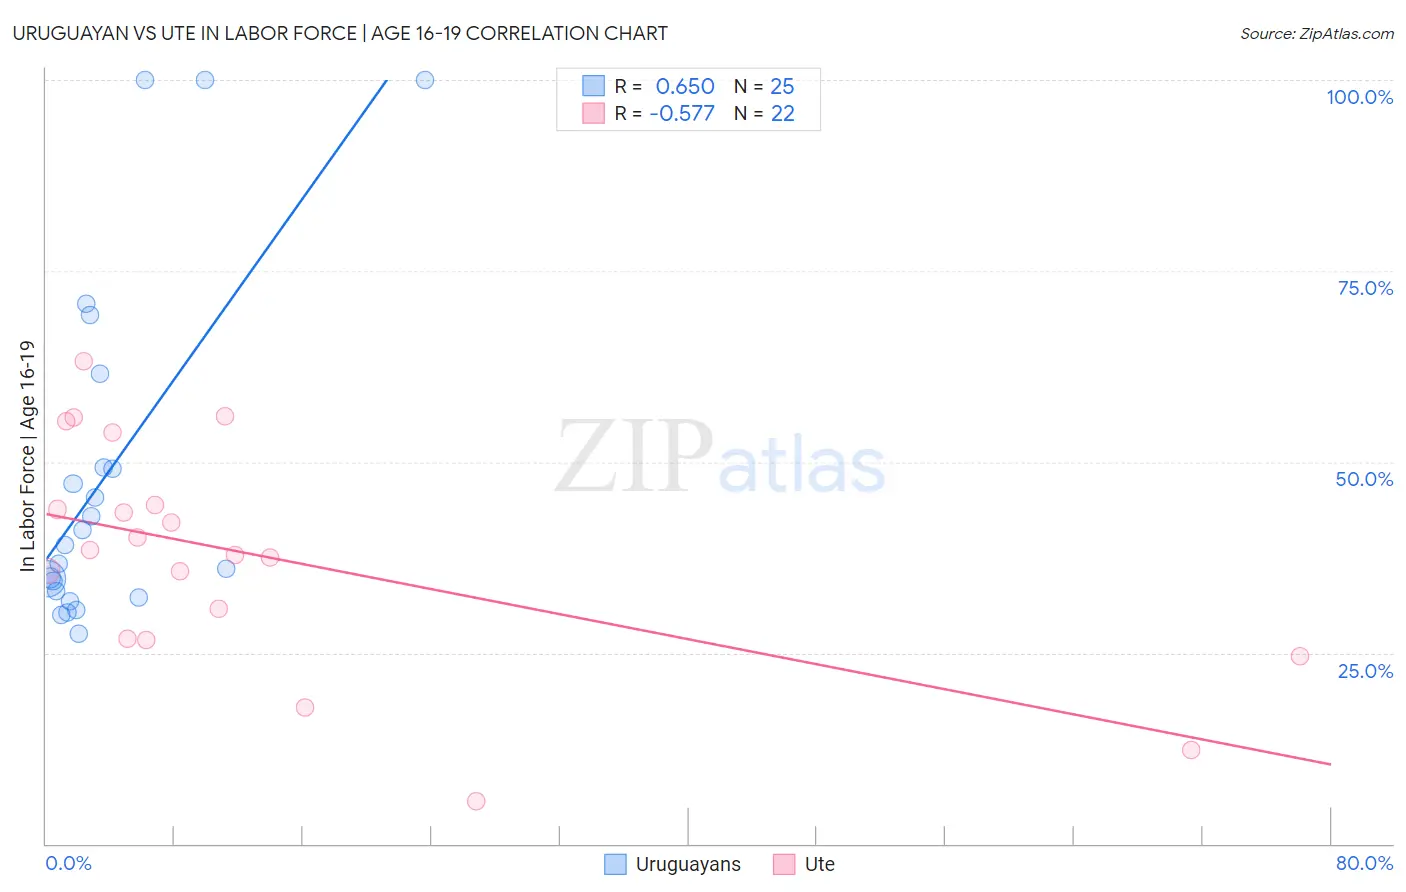
Uruguayan vs Ute In Labor Force | Age 16-19 Correlation Chart
The statistical analysis conducted on geographies consisting of 144,711,789 people shows a significant positive correlation between the proportion of Uruguayans and labor force participation rate among population between the ages 16 and 19 in the United States with a correlation coefficient (R) of 0.650 and weighted average of 34.9%. Similarly, the statistical analysis conducted on geographies consisting of 55,645,372 people shows a substantial negative correlation between the proportion of Ute and labor force participation rate among population between the ages 16 and 19 in the United States with a correlation coefficient (R) of -0.577 and weighted average of 37.1%, a difference of 6.2%.
In Labor Force | Age 16-19 Correlation Summary
| Measurement | Uruguayan | Ute |
| Minimum | 27.5% | 5.6% |
| Maximum | 100.0% | 63.1% |
| Range | 72.5% | 57.5% |
| Mean | 48.3% | 37.6% |
| Median | 39.1% | 38.1% |
| Interquartile 25% (IQ1) | 32.6% | 26.8% |
| Interquartile 75% (IQ3) | 55.3% | 44.4% |
| Interquartile Range (IQR) | 22.7% | 17.6% |
| Standard Deviation (Sample) | 22.7% | 14.7% |
| Standard Deviation (Population) | 22.2% | 14.4% |
Similar Demographics by In Labor Force | Age 16-19
Demographics Similar to Uruguayans by In Labor Force | Age 16-19
In terms of in labor force | age 16-19, the demographic groups most similar to Uruguayans are Pueblo (34.9%, a difference of 0.030%), Immigrants from Turkey (34.9%, a difference of 0.050%), Immigrants from Greece (34.9%, a difference of 0.10%), Immigrants from Ireland (35.0%, a difference of 0.13%), and Immigrants from Sri Lanka (34.9%, a difference of 0.13%).
| Demographics | Rating | Rank | In Labor Force | Age 16-19 |
| Immigrants | Philippines | 4.0 /100 | #235 | Tragic 35.1% |
| Immigrants | Australia | 3.6 /100 | #236 | Tragic 35.1% |
| Immigrants | India | 3.5 /100 | #237 | Tragic 35.0% |
| Immigrants | Vietnam | 3.4 /100 | #238 | Tragic 35.0% |
| Inupiat | 3.2 /100 | #239 | Tragic 35.0% |
| Immigrants | Central America | 3.0 /100 | #240 | Tragic 35.0% |
| Immigrants | Ireland | 2.9 /100 | #241 | Tragic 35.0% |
| Uruguayans | 2.6 /100 | #242 | Tragic 34.9% |
| Pueblo | 2.6 /100 | #243 | Tragic 34.9% |
| Immigrants | Turkey | 2.6 /100 | #244 | Tragic 34.9% |
| Immigrants | Greece | 2.4 /100 | #245 | Tragic 34.9% |
| Immigrants | Sri Lanka | 2.4 /100 | #246 | Tragic 34.9% |
| Laotians | 2.4 /100 | #247 | Tragic 34.9% |
| Central Americans | 2.2 /100 | #248 | Tragic 34.8% |
| Immigrants | Ukraine | 2.2 /100 | #249 | Tragic 34.8% |
Demographics Similar to Ute by In Labor Force | Age 16-19
In terms of in labor force | age 16-19, the demographic groups most similar to Ute are Immigrants from Brazil (37.1%, a difference of 0.050%), Yaqui (37.1%, a difference of 0.080%), Immigrants from Saudi Arabia (37.0%, a difference of 0.12%), Cambodian (37.0%, a difference of 0.27%), and Kiowa (37.2%, a difference of 0.34%).
| Demographics | Rating | Rank | In Labor Force | Age 16-19 |
| Immigrants | Poland | 84.4 /100 | #151 | Excellent 37.3% |
| Immigrants | Sierra Leone | 83.6 /100 | #152 | Excellent 37.3% |
| Arapaho | 81.8 /100 | #153 | Excellent 37.3% |
| Immigrants | Bulgaria | 81.6 /100 | #154 | Excellent 37.3% |
| Immigrants | Lithuania | 80.7 /100 | #155 | Excellent 37.2% |
| Kiowa | 80.4 /100 | #156 | Excellent 37.2% |
| Immigrants | Brazil | 76.5 /100 | #157 | Good 37.1% |
| Ute | 75.7 /100 | #158 | Good 37.1% |
| Yaqui | 74.4 /100 | #159 | Good 37.1% |
| Immigrants | Saudi Arabia | 73.9 /100 | #160 | Good 37.0% |
| Cambodians | 71.5 /100 | #161 | Good 37.0% |
| Immigrants | Jordan | 69.5 /100 | #162 | Good 36.9% |
| Bermudans | 69.3 /100 | #163 | Good 36.9% |
| Immigrants | Kuwait | 68.9 /100 | #164 | Good 36.9% |
| Yakama | 66.9 /100 | #165 | Good 36.9% |