Palestinian vs Ute In Labor Force | Age 16-19
COMPARE
Palestinian
Ute
In Labor Force | Age 16-19
In Labor Force | Age 16-19 Comparison
Palestinians
Ute
36.8%
IN LABOR FORCE | AGE 16-19
63.1/ 100
METRIC RATING
168th/ 347
METRIC RANK
37.1%
IN LABOR FORCE | AGE 16-19
75.7/ 100
METRIC RATING
158th/ 347
METRIC RANK
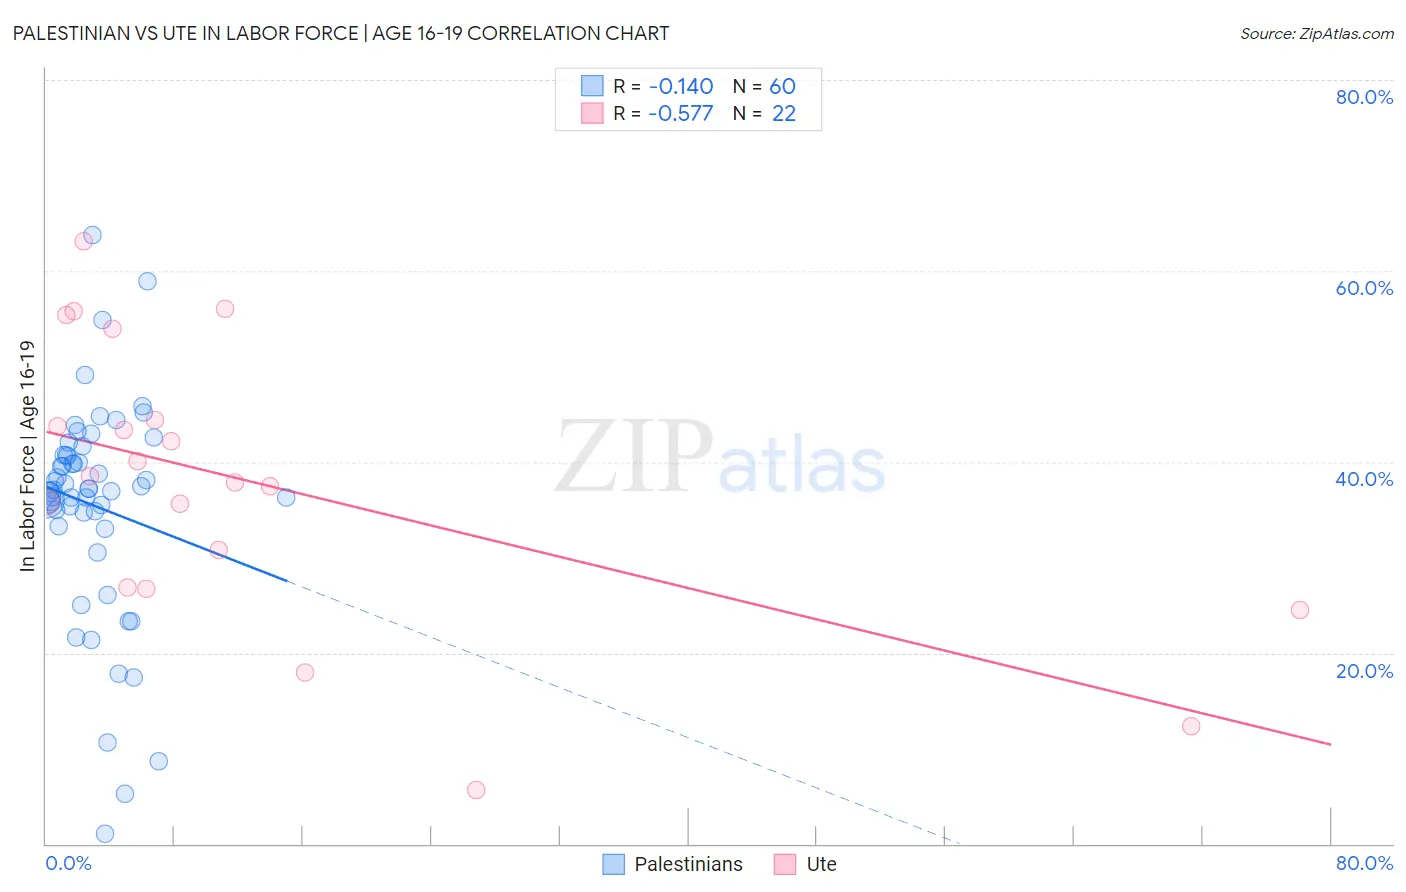
Palestinian vs Ute In Labor Force | Age 16-19 Correlation Chart
The statistical analysis conducted on geographies consisting of 216,397,857 people shows a poor negative correlation between the proportion of Palestinians and labor force participation rate among population between the ages 16 and 19 in the United States with a correlation coefficient (R) of -0.140 and weighted average of 36.8%. Similarly, the statistical analysis conducted on geographies consisting of 55,645,372 people shows a substantial negative correlation between the proportion of Ute and labor force participation rate among population between the ages 16 and 19 in the United States with a correlation coefficient (R) of -0.577 and weighted average of 37.1%, a difference of 0.75%.
In Labor Force | Age 16-19 Correlation Summary
| Measurement | Palestinian | Ute |
| Minimum | 1.1% | 5.6% |
| Maximum | 63.8% | 63.1% |
| Range | 62.7% | 57.5% |
| Mean | 35.4% | 37.6% |
| Median | 37.1% | 38.1% |
| Interquartile 25% (IQ1) | 34.0% | 26.8% |
| Interquartile 75% (IQ3) | 40.7% | 44.4% |
| Interquartile Range (IQR) | 6.8% | 17.6% |
| Standard Deviation (Sample) | 11.5% | 14.7% |
| Standard Deviation (Population) | 11.4% | 14.4% |
Demographics Similar to Palestinians and Ute by In Labor Force | Age 16-19
In terms of in labor force | age 16-19, the demographic groups most similar to Palestinians are Arab (36.8%, a difference of 0.030%), Immigrants from Latvia (36.8%, a difference of 0.080%), Immigrants from South Africa (36.8%, a difference of 0.14%), Immigrants from Western Africa (36.9%, a difference of 0.20%), and Yakama (36.9%, a difference of 0.21%). Similarly, the demographic groups most similar to Ute are Immigrants from Brazil (37.1%, a difference of 0.050%), Yaqui (37.1%, a difference of 0.080%), Immigrants from Saudi Arabia (37.0%, a difference of 0.12%), Cambodian (37.0%, a difference of 0.27%), and Kiowa (37.2%, a difference of 0.34%).
| Demographics | Rating | Rank | In Labor Force | Age 16-19 |
| Arapaho | 81.8 /100 | #153 | Excellent 37.3% |
| Immigrants | Bulgaria | 81.6 /100 | #154 | Excellent 37.3% |
| Immigrants | Lithuania | 80.7 /100 | #155 | Excellent 37.2% |
| Kiowa | 80.4 /100 | #156 | Excellent 37.2% |
| Immigrants | Brazil | 76.5 /100 | #157 | Good 37.1% |
| Ute | 75.7 /100 | #158 | Good 37.1% |
| Yaqui | 74.4 /100 | #159 | Good 37.1% |
| Immigrants | Saudi Arabia | 73.9 /100 | #160 | Good 37.0% |
| Cambodians | 71.5 /100 | #161 | Good 37.0% |
| Immigrants | Jordan | 69.5 /100 | #162 | Good 36.9% |
| Bermudans | 69.3 /100 | #163 | Good 36.9% |
| Immigrants | Kuwait | 68.9 /100 | #164 | Good 36.9% |
| Yakama | 66.9 /100 | #165 | Good 36.9% |
| Immigrants | Western Africa | 66.7 /100 | #166 | Good 36.9% |
| Arabs | 63.6 /100 | #167 | Good 36.8% |
| Palestinians | 63.1 /100 | #168 | Good 36.8% |
| Immigrants | Latvia | 61.6 /100 | #169 | Good 36.8% |
| Immigrants | South Africa | 60.5 /100 | #170 | Good 36.8% |
| Immigrants | Cambodia | 58.4 /100 | #171 | Average 36.7% |
| South Africans | 58.3 /100 | #172 | Average 36.7% |
| Russians | 57.5 /100 | #173 | Average 36.7% |