Immigrants from Barbados vs South American Indian In Labor Force | Age 16-19
COMPARE
Immigrants from Barbados
South American Indian
In Labor Force | Age 16-19
In Labor Force | Age 16-19 Comparison
Immigrants from Barbados
South American Indians
29.0%
IN LABOR FORCE | AGE 16-19
0.0/ 100
METRIC RATING
342nd/ 347
METRIC RANK
35.8%
IN LABOR FORCE | AGE 16-19
14.6/ 100
METRIC RATING
205th/ 347
METRIC RANK
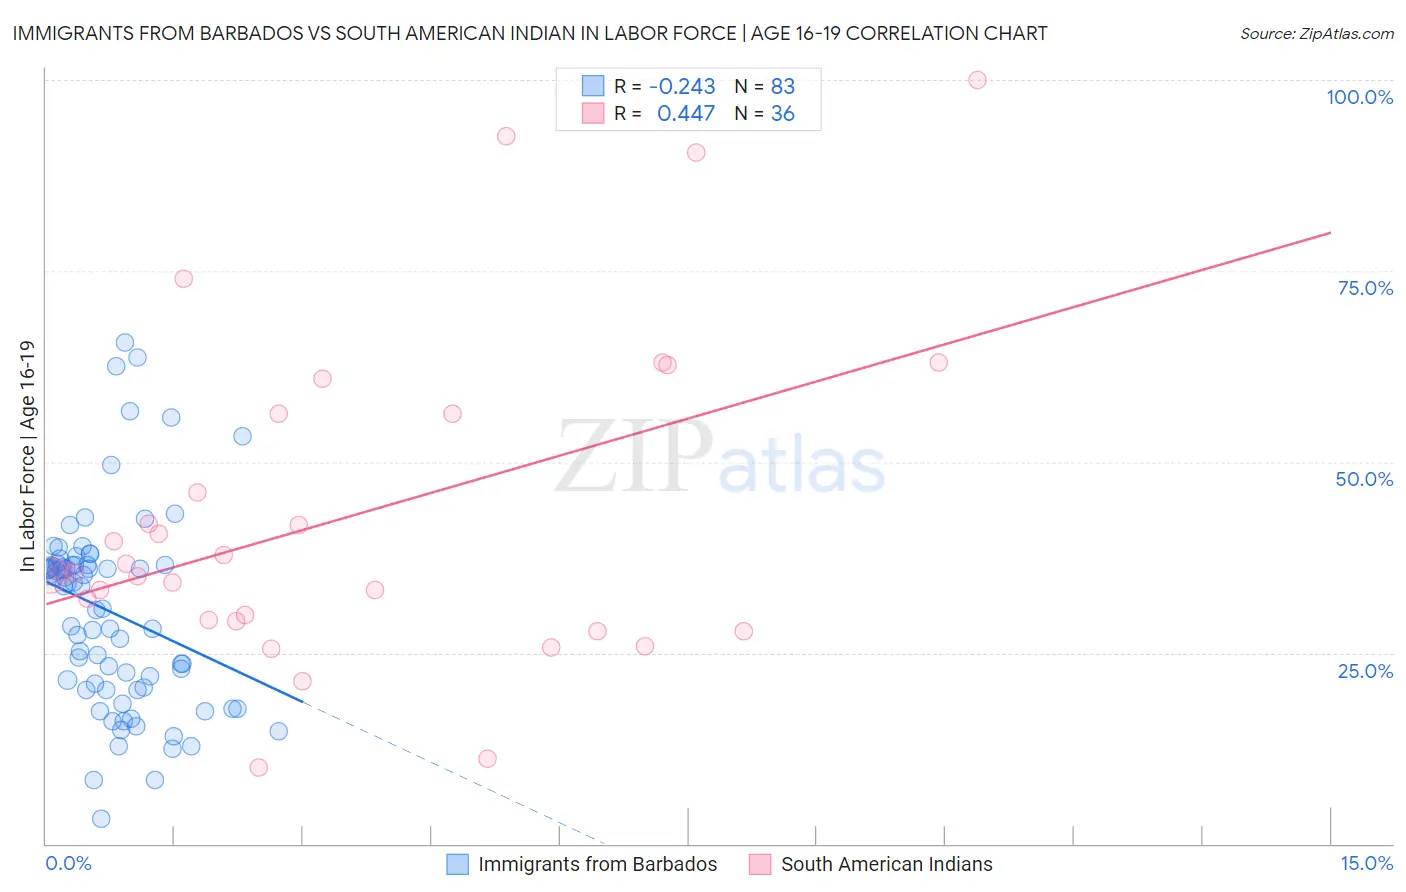
Immigrants from Barbados vs South American Indian In Labor Force | Age 16-19 Correlation Chart
The statistical analysis conducted on geographies consisting of 112,727,809 people shows a weak negative correlation between the proportion of Immigrants from Barbados and labor force participation rate among population between the ages 16 and 19 in the United States with a correlation coefficient (R) of -0.243 and weighted average of 29.0%. Similarly, the statistical analysis conducted on geographies consisting of 164,452,175 people shows a moderate positive correlation between the proportion of South American Indians and labor force participation rate among population between the ages 16 and 19 in the United States with a correlation coefficient (R) of 0.447 and weighted average of 35.8%, a difference of 23.4%.
In Labor Force | Age 16-19 Correlation Summary
| Measurement | Immigrants from Barbados | South American Indian |
| Minimum | 3.3% | 10.0% |
| Maximum | 65.6% | 100.0% |
| Range | 62.3% | 90.0% |
| Mean | 30.3% | 42.8% |
| Median | 33.7% | 35.6% |
| Interquartile 25% (IQ1) | 20.2% | 29.3% |
| Interquartile 75% (IQ3) | 36.5% | 56.3% |
| Interquartile Range (IQR) | 16.3% | 27.0% |
| Standard Deviation (Sample) | 12.8% | 21.4% |
| Standard Deviation (Population) | 12.7% | 21.1% |
Similar Demographics by In Labor Force | Age 16-19
Demographics Similar to Immigrants from Barbados by In Labor Force | Age 16-19
In terms of in labor force | age 16-19, the demographic groups most similar to Immigrants from Barbados are Immigrants from Armenia (29.0%, a difference of 0.15%), British West Indian (29.1%, a difference of 0.38%), Immigrants from Uzbekistan (29.2%, a difference of 0.58%), Vietnamese (29.6%, a difference of 2.0%), and Immigrants from Bangladesh (30.0%, a difference of 3.7%).
| Demographics | Rating | Rank | In Labor Force | Age 16-19 |
| Immigrants | Hong Kong | 0.0 /100 | #333 | Tragic 30.5% |
| Puerto Ricans | 0.0 /100 | #334 | Tragic 30.3% |
| Immigrants | Cuba | 0.0 /100 | #335 | Tragic 30.2% |
| Immigrants | Trinidad and Tobago | 0.0 /100 | #336 | Tragic 30.2% |
| Immigrants | Bangladesh | 0.0 /100 | #337 | Tragic 30.0% |
| Vietnamese | 0.0 /100 | #338 | Tragic 29.6% |
| Immigrants | Uzbekistan | 0.0 /100 | #339 | Tragic 29.2% |
| British West Indians | 0.0 /100 | #340 | Tragic 29.1% |
| Immigrants | Armenia | 0.0 /100 | #341 | Tragic 29.0% |
| Immigrants | Barbados | 0.0 /100 | #342 | Tragic 29.0% |
| Yuman | 0.0 /100 | #343 | Tragic 27.7% |
| Guyanese | 0.0 /100 | #344 | Tragic 27.4% |
| Immigrants | Guyana | 0.0 /100 | #345 | Tragic 27.3% |
| Immigrants | St. Vincent and the Grenadines | 0.0 /100 | #346 | Tragic 26.3% |
| Immigrants | Grenada | 0.0 /100 | #347 | Tragic 25.4% |
Demographics Similar to South American Indians by In Labor Force | Age 16-19
In terms of in labor force | age 16-19, the demographic groups most similar to South American Indians are Chilean (35.8%, a difference of 0.0%), Immigrants from Eastern Europe (35.8%, a difference of 0.020%), Immigrants from Albania (35.8%, a difference of 0.040%), Korean (35.7%, a difference of 0.14%), and Immigrants from Nigeria (35.8%, a difference of 0.21%).
| Demographics | Rating | Rank | In Labor Force | Age 16-19 |
| Immigrants | Northern Africa | 19.9 /100 | #198 | Poor 35.9% |
| Immigrants | Norway | 19.8 /100 | #199 | Poor 35.9% |
| Immigrants | Sweden | 18.8 /100 | #200 | Poor 35.9% |
| Alsatians | 17.5 /100 | #201 | Poor 35.9% |
| Senegalese | 17.4 /100 | #202 | Poor 35.9% |
| Immigrants | Nigeria | 16.8 /100 | #203 | Poor 35.8% |
| Immigrants | Albania | 15.0 /100 | #204 | Poor 35.8% |
| South American Indians | 14.6 /100 | #205 | Poor 35.8% |
| Chileans | 14.6 /100 | #206 | Poor 35.8% |
| Immigrants | Eastern Europe | 14.5 /100 | #207 | Poor 35.8% |
| Koreans | 13.3 /100 | #208 | Poor 35.7% |
| Moroccans | 12.7 /100 | #209 | Poor 35.7% |
| Immigrants | Switzerland | 11.9 /100 | #210 | Poor 35.6% |
| Mexicans | 11.9 /100 | #211 | Poor 35.6% |
| Houma | 11.0 /100 | #212 | Poor 35.6% |