Immigrants from Barbados vs Immigrants from Turkey In Labor Force | Age 16-19
COMPARE
Immigrants from Barbados
Immigrants from Turkey
In Labor Force | Age 16-19
In Labor Force | Age 16-19 Comparison
Immigrants from Barbados
Immigrants from Turkey
29.0%
IN LABOR FORCE | AGE 16-19
0.0/ 100
METRIC RATING
342nd/ 347
METRIC RANK
34.9%
IN LABOR FORCE | AGE 16-19
2.6/ 100
METRIC RATING
244th/ 347
METRIC RANK
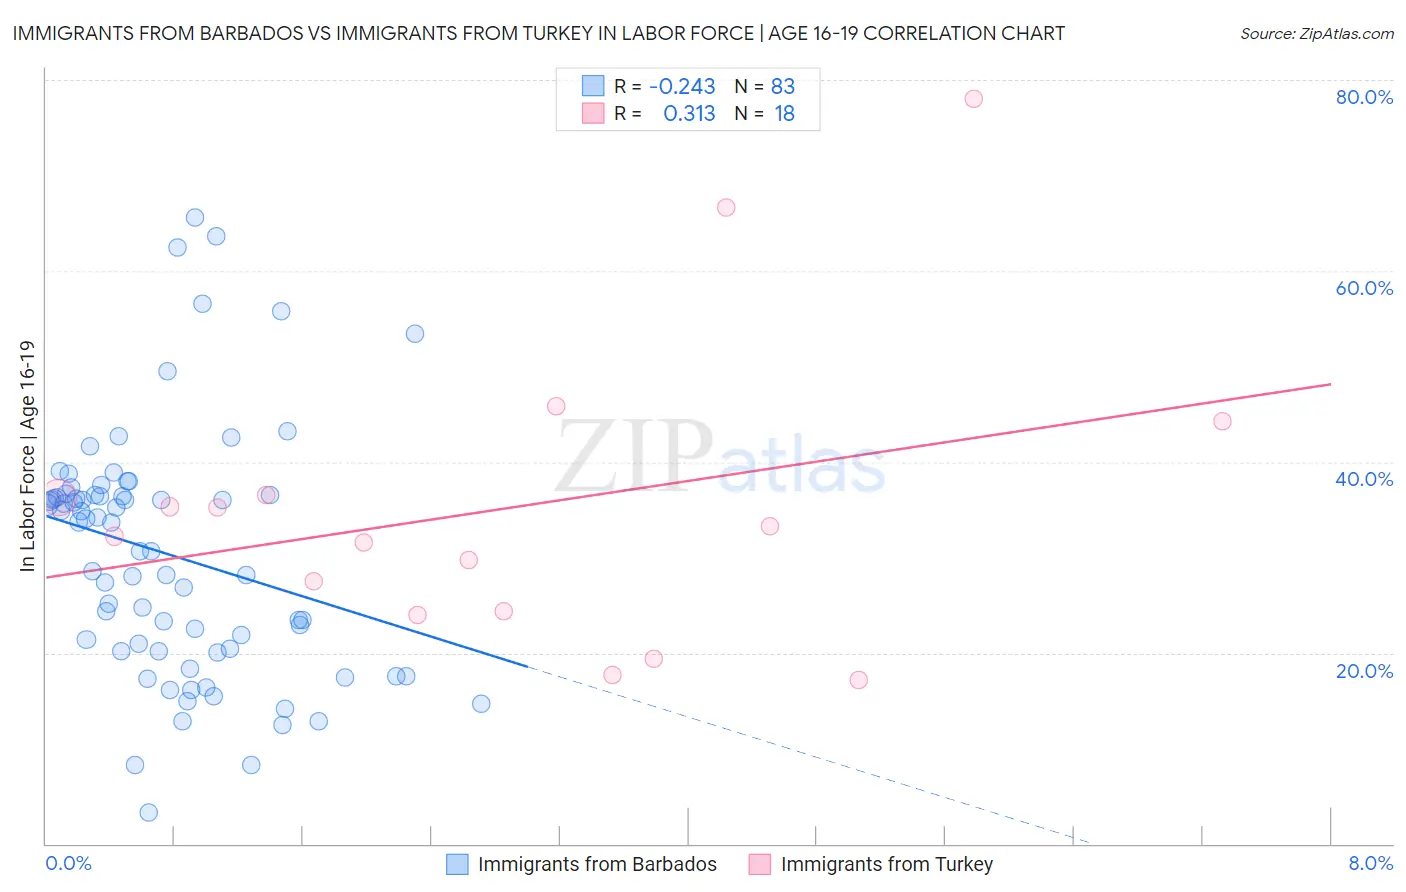
Immigrants from Barbados vs Immigrants from Turkey In Labor Force | Age 16-19 Correlation Chart
The statistical analysis conducted on geographies consisting of 112,727,809 people shows a weak negative correlation between the proportion of Immigrants from Barbados and labor force participation rate among population between the ages 16 and 19 in the United States with a correlation coefficient (R) of -0.243 and weighted average of 29.0%. Similarly, the statistical analysis conducted on geographies consisting of 222,808,071 people shows a mild positive correlation between the proportion of Immigrants from Turkey and labor force participation rate among population between the ages 16 and 19 in the United States with a correlation coefficient (R) of 0.313 and weighted average of 34.9%, a difference of 20.4%.
In Labor Force | Age 16-19 Correlation Summary
| Measurement | Immigrants from Barbados | Immigrants from Turkey |
| Minimum | 3.3% | 17.1% |
| Maximum | 65.6% | 78.1% |
| Range | 62.3% | 61.0% |
| Mean | 30.3% | 35.3% |
| Median | 33.7% | 32.8% |
| Interquartile 25% (IQ1) | 20.2% | 24.3% |
| Interquartile 75% (IQ3) | 36.5% | 36.6% |
| Interquartile Range (IQR) | 16.3% | 12.3% |
| Standard Deviation (Sample) | 12.8% | 15.8% |
| Standard Deviation (Population) | 12.7% | 15.4% |
Similar Demographics by In Labor Force | Age 16-19
Demographics Similar to Immigrants from Barbados by In Labor Force | Age 16-19
In terms of in labor force | age 16-19, the demographic groups most similar to Immigrants from Barbados are Immigrants from Armenia (29.0%, a difference of 0.15%), British West Indian (29.1%, a difference of 0.38%), Immigrants from Uzbekistan (29.2%, a difference of 0.58%), Vietnamese (29.6%, a difference of 2.0%), and Immigrants from Bangladesh (30.0%, a difference of 3.7%).
| Demographics | Rating | Rank | In Labor Force | Age 16-19 |
| Immigrants | Hong Kong | 0.0 /100 | #333 | Tragic 30.5% |
| Puerto Ricans | 0.0 /100 | #334 | Tragic 30.3% |
| Immigrants | Cuba | 0.0 /100 | #335 | Tragic 30.2% |
| Immigrants | Trinidad and Tobago | 0.0 /100 | #336 | Tragic 30.2% |
| Immigrants | Bangladesh | 0.0 /100 | #337 | Tragic 30.0% |
| Vietnamese | 0.0 /100 | #338 | Tragic 29.6% |
| Immigrants | Uzbekistan | 0.0 /100 | #339 | Tragic 29.2% |
| British West Indians | 0.0 /100 | #340 | Tragic 29.1% |
| Immigrants | Armenia | 0.0 /100 | #341 | Tragic 29.0% |
| Immigrants | Barbados | 0.0 /100 | #342 | Tragic 29.0% |
| Yuman | 0.0 /100 | #343 | Tragic 27.7% |
| Guyanese | 0.0 /100 | #344 | Tragic 27.4% |
| Immigrants | Guyana | 0.0 /100 | #345 | Tragic 27.3% |
| Immigrants | St. Vincent and the Grenadines | 0.0 /100 | #346 | Tragic 26.3% |
| Immigrants | Grenada | 0.0 /100 | #347 | Tragic 25.4% |
Demographics Similar to Immigrants from Turkey by In Labor Force | Age 16-19
In terms of in labor force | age 16-19, the demographic groups most similar to Immigrants from Turkey are Pueblo (34.9%, a difference of 0.020%), Uruguayan (34.9%, a difference of 0.050%), Immigrants from Greece (34.9%, a difference of 0.060%), Immigrants from Sri Lanka (34.9%, a difference of 0.080%), and Laotian (34.9%, a difference of 0.090%).
| Demographics | Rating | Rank | In Labor Force | Age 16-19 |
| Immigrants | India | 3.5 /100 | #237 | Tragic 35.0% |
| Immigrants | Vietnam | 3.4 /100 | #238 | Tragic 35.0% |
| Inupiat | 3.2 /100 | #239 | Tragic 35.0% |
| Immigrants | Central America | 3.0 /100 | #240 | Tragic 35.0% |
| Immigrants | Ireland | 2.9 /100 | #241 | Tragic 35.0% |
| Uruguayans | 2.6 /100 | #242 | Tragic 34.9% |
| Pueblo | 2.6 /100 | #243 | Tragic 34.9% |
| Immigrants | Turkey | 2.6 /100 | #244 | Tragic 34.9% |
| Immigrants | Greece | 2.4 /100 | #245 | Tragic 34.9% |
| Immigrants | Sri Lanka | 2.4 /100 | #246 | Tragic 34.9% |
| Laotians | 2.4 /100 | #247 | Tragic 34.9% |
| Central Americans | 2.2 /100 | #248 | Tragic 34.8% |
| Immigrants | Ukraine | 2.2 /100 | #249 | Tragic 34.8% |
| Immigrants | Pakistan | 2.0 /100 | #250 | Tragic 34.8% |
| Immigrants | Western Asia | 2.0 /100 | #251 | Tragic 34.8% |