Immigrants from Barbados vs Syrian In Labor Force | Age 16-19
COMPARE
Immigrants from Barbados
Syrian
In Labor Force | Age 16-19
In Labor Force | Age 16-19 Comparison
Immigrants from Barbados
Syrians
29.0%
IN LABOR FORCE | AGE 16-19
0.0/ 100
METRIC RATING
342nd/ 347
METRIC RANK
37.6%
IN LABOR FORCE | AGE 16-19
90.7/ 100
METRIC RATING
141st/ 347
METRIC RANK
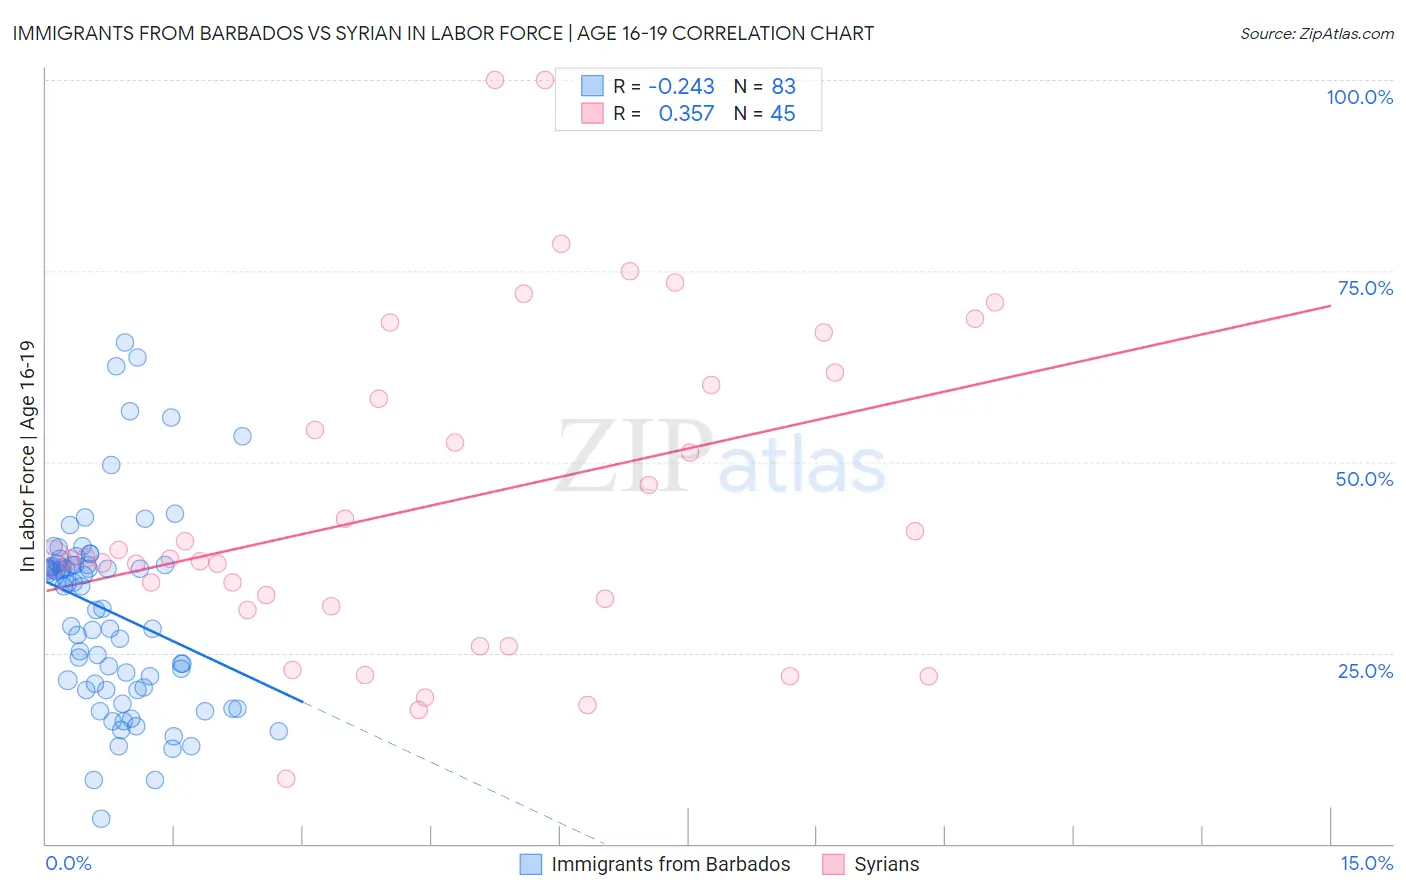
Immigrants from Barbados vs Syrian In Labor Force | Age 16-19 Correlation Chart
The statistical analysis conducted on geographies consisting of 112,727,809 people shows a weak negative correlation between the proportion of Immigrants from Barbados and labor force participation rate among population between the ages 16 and 19 in the United States with a correlation coefficient (R) of -0.243 and weighted average of 29.0%. Similarly, the statistical analysis conducted on geographies consisting of 266,042,941 people shows a mild positive correlation between the proportion of Syrians and labor force participation rate among population between the ages 16 and 19 in the United States with a correlation coefficient (R) of 0.357 and weighted average of 37.6%, a difference of 29.8%.
In Labor Force | Age 16-19 Correlation Summary
| Measurement | Immigrants from Barbados | Syrian |
| Minimum | 3.3% | 8.6% |
| Maximum | 65.6% | 100.0% |
| Range | 62.3% | 91.4% |
| Mean | 30.3% | 44.8% |
| Median | 33.7% | 37.3% |
| Interquartile 25% (IQ1) | 20.2% | 30.9% |
| Interquartile 75% (IQ3) | 36.5% | 60.9% |
| Interquartile Range (IQR) | 16.3% | 30.0% |
| Standard Deviation (Sample) | 12.8% | 21.6% |
| Standard Deviation (Population) | 12.7% | 21.4% |
Similar Demographics by In Labor Force | Age 16-19
Demographics Similar to Immigrants from Barbados by In Labor Force | Age 16-19
In terms of in labor force | age 16-19, the demographic groups most similar to Immigrants from Barbados are Immigrants from Armenia (29.0%, a difference of 0.15%), British West Indian (29.1%, a difference of 0.38%), Immigrants from Uzbekistan (29.2%, a difference of 0.58%), Vietnamese (29.6%, a difference of 2.0%), and Immigrants from Bangladesh (30.0%, a difference of 3.7%).
| Demographics | Rating | Rank | In Labor Force | Age 16-19 |
| Immigrants | Hong Kong | 0.0 /100 | #333 | Tragic 30.5% |
| Puerto Ricans | 0.0 /100 | #334 | Tragic 30.3% |
| Immigrants | Cuba | 0.0 /100 | #335 | Tragic 30.2% |
| Immigrants | Trinidad and Tobago | 0.0 /100 | #336 | Tragic 30.2% |
| Immigrants | Bangladesh | 0.0 /100 | #337 | Tragic 30.0% |
| Vietnamese | 0.0 /100 | #338 | Tragic 29.6% |
| Immigrants | Uzbekistan | 0.0 /100 | #339 | Tragic 29.2% |
| British West Indians | 0.0 /100 | #340 | Tragic 29.1% |
| Immigrants | Armenia | 0.0 /100 | #341 | Tragic 29.0% |
| Immigrants | Barbados | 0.0 /100 | #342 | Tragic 29.0% |
| Yuman | 0.0 /100 | #343 | Tragic 27.7% |
| Guyanese | 0.0 /100 | #344 | Tragic 27.4% |
| Immigrants | Guyana | 0.0 /100 | #345 | Tragic 27.3% |
| Immigrants | St. Vincent and the Grenadines | 0.0 /100 | #346 | Tragic 26.3% |
| Immigrants | Grenada | 0.0 /100 | #347 | Tragic 25.4% |
Demographics Similar to Syrians by In Labor Force | Age 16-19
In terms of in labor force | age 16-19, the demographic groups most similar to Syrians are Estonian (37.7%, a difference of 0.14%), Sierra Leonean (37.6%, a difference of 0.15%), Immigrants from Moldova (37.7%, a difference of 0.17%), Pakistani (37.6%, a difference of 0.18%), and Comanche (37.7%, a difference of 0.19%).
| Demographics | Rating | Rank | In Labor Force | Age 16-19 |
| Immigrants | Netherlands | 93.7 /100 | #134 | Exceptional 37.8% |
| Macedonians | 93.4 /100 | #135 | Exceptional 37.8% |
| Australians | 93.2 /100 | #136 | Exceptional 37.8% |
| Cajuns | 93.2 /100 | #137 | Exceptional 37.8% |
| Comanche | 91.9 /100 | #138 | Exceptional 37.7% |
| Immigrants | Moldova | 91.9 /100 | #139 | Exceptional 37.7% |
| Estonians | 91.7 /100 | #140 | Exceptional 37.7% |
| Syrians | 90.7 /100 | #141 | Exceptional 37.6% |
| Sierra Leoneans | 89.7 /100 | #142 | Excellent 37.6% |
| Pakistanis | 89.5 /100 | #143 | Excellent 37.6% |
| Japanese | 89.3 /100 | #144 | Excellent 37.5% |
| Paiute | 89.3 /100 | #145 | Excellent 37.5% |
| Immigrants | Western Europe | 88.9 /100 | #146 | Excellent 37.5% |
| Brazilians | 88.7 /100 | #147 | Excellent 37.5% |
| Romanians | 87.3 /100 | #148 | Excellent 37.5% |