Immigrants from Barbados vs Ute Disability
COMPARE
Immigrants from Barbados
Ute
Disability
Disability Comparison
Immigrants from Barbados
Ute
11.6%
DISABILITY
64.2/ 100
METRIC RATING
160th/ 347
METRIC RANK
11.9%
DISABILITY
19.5/ 100
METRIC RATING
191st/ 347
METRIC RANK
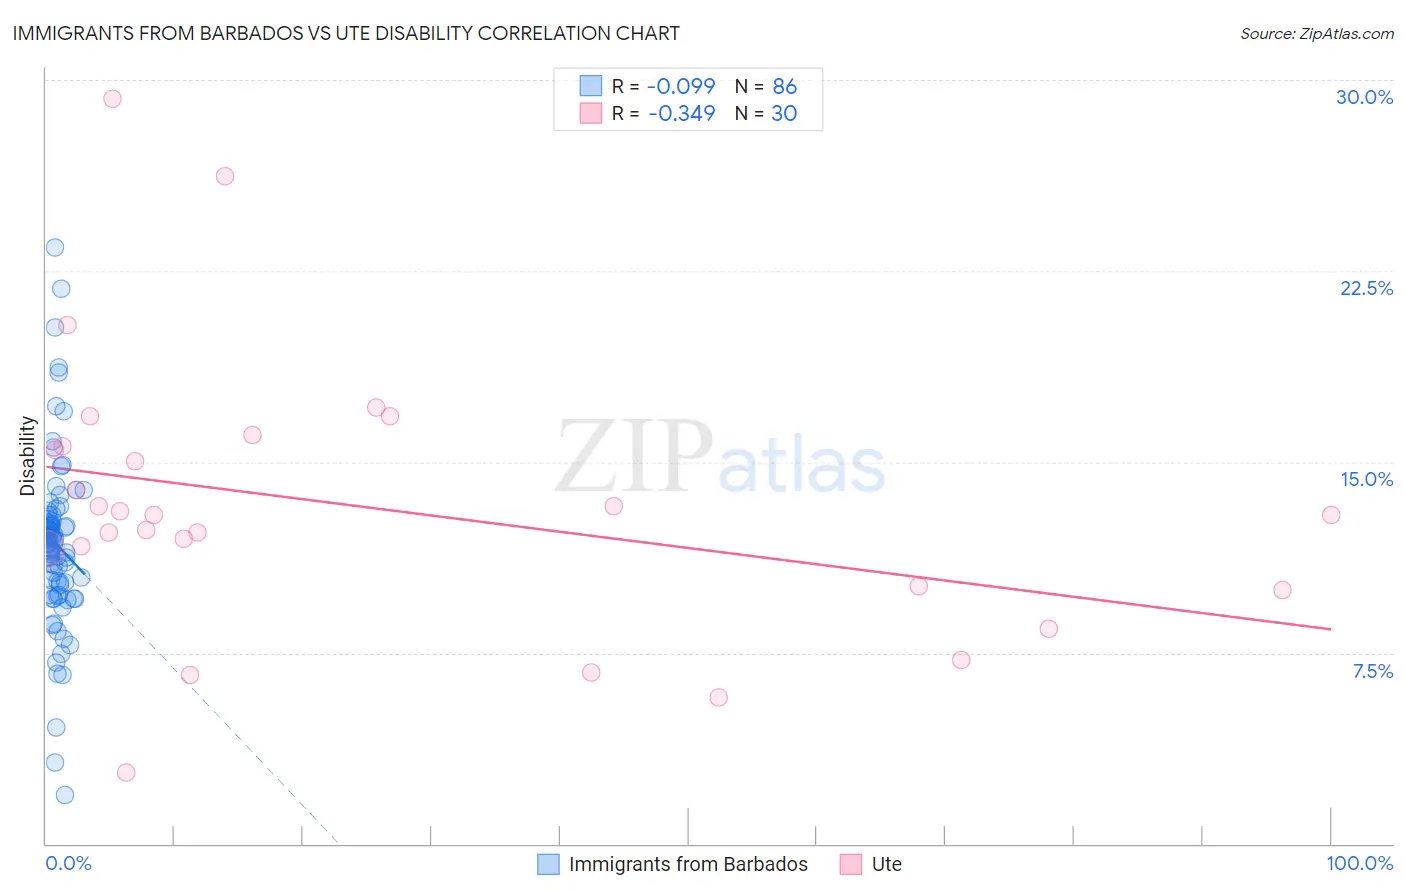
Immigrants from Barbados vs Ute Disability Correlation Chart
The statistical analysis conducted on geographies consisting of 112,783,237 people shows a slight negative correlation between the proportion of Immigrants from Barbados and percentage of population with a disability in the United States with a correlation coefficient (R) of -0.099 and weighted average of 11.6%. Similarly, the statistical analysis conducted on geographies consisting of 55,668,381 people shows a mild negative correlation between the proportion of Ute and percentage of population with a disability in the United States with a correlation coefficient (R) of -0.349 and weighted average of 11.9%, a difference of 2.2%.
Disability Correlation Summary
| Measurement | Immigrants from Barbados | Ute |
| Minimum | 1.9% | 2.8% |
| Maximum | 23.4% | 29.3% |
| Range | 21.5% | 26.5% |
| Mean | 11.8% | 13.3% |
| Median | 11.8% | 12.9% |
| Interquartile 25% (IQ1) | 10.2% | 10.1% |
| Interquartile 75% (IQ3) | 12.7% | 15.6% |
| Interquartile Range (IQR) | 2.6% | 5.5% |
| Standard Deviation (Sample) | 3.4% | 5.5% |
| Standard Deviation (Population) | 3.4% | 5.4% |
Similar Demographics by Disability
Demographics Similar to Immigrants from Barbados by Disability
In terms of disability, the demographic groups most similar to Immigrants from Barbados are Guatemalan (11.6%, a difference of 0.040%), Immigrants from Cuba (11.6%, a difference of 0.070%), Armenian (11.6%, a difference of 0.080%), Immigrants from Haiti (11.7%, a difference of 0.24%), and Immigrants from Trinidad and Tobago (11.7%, a difference of 0.25%).
| Demographics | Rating | Rank | Disability |
| Immigrants | Ghana | 71.2 /100 | #153 | Good 11.6% |
| Immigrants | Guatemala | 71.1 /100 | #154 | Good 11.6% |
| Immigrants | Netherlands | 69.8 /100 | #155 | Good 11.6% |
| Immigrants | Fiji | 69.5 /100 | #156 | Good 11.6% |
| Immigrants | Middle Africa | 69.5 /100 | #157 | Good 11.6% |
| Armenians | 65.9 /100 | #158 | Good 11.6% |
| Guatemalans | 65.1 /100 | #159 | Good 11.6% |
| Immigrants | Barbados | 64.2 /100 | #160 | Good 11.6% |
| Immigrants | Cuba | 62.8 /100 | #161 | Good 11.6% |
| Immigrants | Haiti | 59.2 /100 | #162 | Average 11.7% |
| Immigrants | Trinidad and Tobago | 58.9 /100 | #163 | Average 11.7% |
| Syrians | 58.5 /100 | #164 | Average 11.7% |
| Cubans | 56.7 /100 | #165 | Average 11.7% |
| Pakistanis | 54.7 /100 | #166 | Average 11.7% |
| Estonians | 54.4 /100 | #167 | Average 11.7% |
Demographics Similar to Ute by Disability
In terms of disability, the demographic groups most similar to Ute are Lithuanian (11.9%, a difference of 0.050%), Immigrants from Bosnia and Herzegovina (11.9%, a difference of 0.10%), Immigrants from West Indies (11.9%, a difference of 0.11%), Immigrants from Zaire (11.9%, a difference of 0.16%), and Somali (11.9%, a difference of 0.16%).
| Demographics | Rating | Rank | Disability |
| Iraqis | 30.0 /100 | #184 | Fair 11.8% |
| Immigrants | Burma/Myanmar | 28.5 /100 | #185 | Fair 11.8% |
| Immigrants | Scotland | 28.2 /100 | #186 | Fair 11.8% |
| Lebanese | 27.9 /100 | #187 | Fair 11.8% |
| Immigrants | Mexico | 23.8 /100 | #188 | Fair 11.9% |
| Immigrants | Zaire | 21.8 /100 | #189 | Fair 11.9% |
| Immigrants | West Indies | 21.1 /100 | #190 | Fair 11.9% |
| Ute | 19.5 /100 | #191 | Poor 11.9% |
| Lithuanians | 18.8 /100 | #192 | Poor 11.9% |
| Immigrants | Bosnia and Herzegovina | 18.0 /100 | #193 | Poor 11.9% |
| Somalis | 17.3 /100 | #194 | Poor 11.9% |
| Barbadians | 15.8 /100 | #195 | Poor 11.9% |
| Serbians | 15.4 /100 | #196 | Poor 11.9% |
| Immigrants | Belize | 15.2 /100 | #197 | Poor 11.9% |
| Ukrainians | 14.7 /100 | #198 | Poor 11.9% |