Immigrants from Bahamas vs Immigrants from Denmark In Labor Force | Age 20-64
COMPARE
Immigrants from Bahamas
Immigrants from Denmark
In Labor Force | Age 20-64
In Labor Force | Age 20-64 Comparison
Immigrants from Bahamas
Immigrants from Denmark
78.2%
IN LABOR FORCE | AGE 20-64
0.0/ 100
METRIC RATING
277th/ 347
METRIC RANK
79.4%
IN LABOR FORCE | AGE 20-64
26.9/ 100
METRIC RATING
192nd/ 347
METRIC RANK
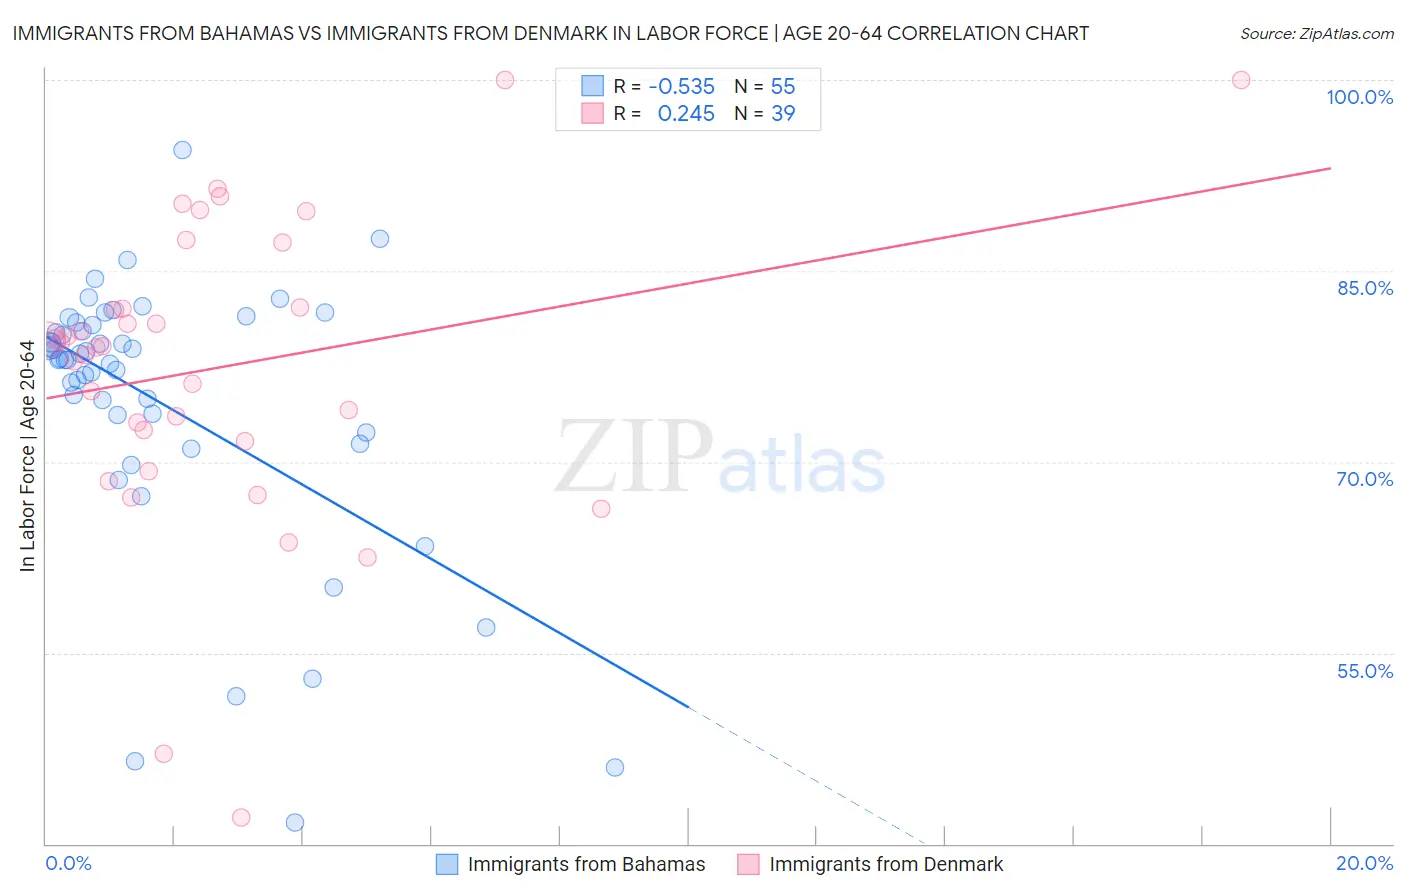
Immigrants from Bahamas vs Immigrants from Denmark In Labor Force | Age 20-64 Correlation Chart
The statistical analysis conducted on geographies consisting of 104,666,072 people shows a substantial negative correlation between the proportion of Immigrants from Bahamas and labor force participation rate among population between the ages 20 and 64 in the United States with a correlation coefficient (R) of -0.535 and weighted average of 78.2%. Similarly, the statistical analysis conducted on geographies consisting of 136,432,253 people shows a weak positive correlation between the proportion of Immigrants from Denmark and labor force participation rate among population between the ages 20 and 64 in the United States with a correlation coefficient (R) of 0.245 and weighted average of 79.4%, a difference of 1.5%.
In Labor Force | Age 20-64 Correlation Summary
| Measurement | Immigrants from Bahamas | Immigrants from Denmark |
| Minimum | 41.7% | 42.1% |
| Maximum | 94.5% | 100.0% |
| Range | 52.8% | 57.9% |
| Mean | 74.7% | 77.4% |
| Median | 78.0% | 79.1% |
| Interquartile 25% (IQ1) | 72.3% | 71.6% |
| Interquartile 75% (IQ3) | 80.8% | 82.1% |
| Interquartile Range (IQR) | 8.5% | 10.5% |
| Standard Deviation (Sample) | 10.7% | 11.9% |
| Standard Deviation (Population) | 10.6% | 11.7% |
Similar Demographics by In Labor Force | Age 20-64
Demographics Similar to Immigrants from Bahamas by In Labor Force | Age 20-64
In terms of in labor force | age 20-64, the demographic groups most similar to Immigrants from Bahamas are Mexican American Indian (78.2%, a difference of 0.0%), Puget Sound Salish (78.2%, a difference of 0.010%), Aleut (78.2%, a difference of 0.020%), Spanish (78.2%, a difference of 0.020%), and French American Indian (78.2%, a difference of 0.050%).
| Demographics | Rating | Rank | In Labor Force | Age 20-64 |
| Scotch-Irish | 0.0 /100 | #270 | Tragic 78.3% |
| Immigrants | Latin America | 0.0 /100 | #271 | Tragic 78.3% |
| Marshallese | 0.0 /100 | #272 | Tragic 78.3% |
| French American Indians | 0.0 /100 | #273 | Tragic 78.2% |
| Aleuts | 0.0 /100 | #274 | Tragic 78.2% |
| Spanish | 0.0 /100 | #275 | Tragic 78.2% |
| Puget Sound Salish | 0.0 /100 | #276 | Tragic 78.2% |
| Immigrants | Bahamas | 0.0 /100 | #277 | Tragic 78.2% |
| Mexican American Indians | 0.0 /100 | #278 | Tragic 78.2% |
| Belizeans | 0.0 /100 | #279 | Tragic 78.2% |
| Immigrants | Dominica | 0.0 /100 | #280 | Tragic 78.1% |
| Guyanese | 0.0 /100 | #281 | Tragic 78.1% |
| Immigrants | St. Vincent and the Grenadines | 0.0 /100 | #282 | Tragic 78.1% |
| Immigrants | Nonimmigrants | 0.0 /100 | #283 | Tragic 78.1% |
| Immigrants | Guyana | 0.0 /100 | #284 | Tragic 78.1% |
Demographics Similar to Immigrants from Denmark by In Labor Force | Age 20-64
In terms of in labor force | age 20-64, the demographic groups most similar to Immigrants from Denmark are Indonesian (79.4%, a difference of 0.010%), Swiss (79.4%, a difference of 0.020%), Immigrants from Thailand (79.4%, a difference of 0.020%), Immigrants from Austria (79.4%, a difference of 0.030%), and Immigrants from El Salvador (79.4%, a difference of 0.040%).
| Demographics | Rating | Rank | In Labor Force | Age 20-64 |
| Israelis | 34.7 /100 | #185 | Fair 79.5% |
| Northern Europeans | 34.5 /100 | #186 | Fair 79.5% |
| Assyrians/Chaldeans/Syriacs | 33.3 /100 | #187 | Fair 79.4% |
| Immigrants | Haiti | 32.1 /100 | #188 | Fair 79.4% |
| Immigrants | El Salvador | 30.9 /100 | #189 | Fair 79.4% |
| Immigrants | Syria | 30.8 /100 | #190 | Fair 79.4% |
| Swiss | 28.9 /100 | #191 | Fair 79.4% |
| Immigrants | Denmark | 26.9 /100 | #192 | Fair 79.4% |
| Indonesians | 26.1 /100 | #193 | Fair 79.4% |
| Immigrants | Thailand | 24.8 /100 | #194 | Fair 79.4% |
| Immigrants | Austria | 23.7 /100 | #195 | Fair 79.4% |
| Ecuadorians | 23.1 /100 | #196 | Fair 79.4% |
| Immigrants | Senegal | 22.5 /100 | #197 | Fair 79.4% |
| Immigrants | Laos | 21.5 /100 | #198 | Fair 79.4% |
| Dutch | 20.2 /100 | #199 | Fair 79.3% |