Asian vs Immigrants from Europe In Labor Force | Age 20-64

COMPARE

Asian
Race
Ancestry
AfghanAfricanAlaska NativeAlaskan AthabascanAlbanianAleutAlsatianAmericanApacheArabArapahoArgentineanArmenianAssyrian/Chaldean/SyriacAustralianAustrianBahamianBangladeshiBarbadianBasqueBelgianBelizeanBermudanBhutaneseBlackfeetBolivianBrazilianBritishBritish West IndianBulgarianBurmeseCajunCambodianCanadianCape VerdeanCarpatho RusynCelticCentral AmericanCentral American IndianCherokeeCheyenneChickasawChileanChineseChippewaChoctawColombianColvilleComancheCosta RicanCreeCreekCroatianCrowCubanCypriotCzechCzechoslovakianDanishDelawareDominicanDutchDutch West IndianEastern EuropeanEcuadorianEgyptianEnglishEstonianEthiopianEuropeanFijianFilipinoFinnishFrenchFrench American IndianFrench CanadianGermanGerman RussianGhanaianGreekGuamanian/ChamorroGuatemalanGuyaneseHaitianHmongHonduranHopiHoumaHungarianIcelanderIndian (Asian)IndonesianInupiatIranianIraqiIrishIroquoisIsraeliItalianJamaicanJapaneseJordanianKenyanKiowaKoreanLaotianLatvianLebaneseLiberianLithuanianLumbeeLuxembourgerMacedonianMalaysianMalteseMarshalleseMenomineeMexicanMexican American IndianMongolianMoroccanNative HawaiianNavajoNepaleseNew ZealanderNicaraguanNigerianNorthern EuropeanNorwegianOkinawanOsageOttawaPaiutePakistaniPalestinianPanamanianParaguayanPennsylvania GermanPeruvianPimaPolishPortuguesePotawatomiPuebloPuerto RicanPuget Sound SalishRomanianRussianSalvadoranSamoanScandinavianScotch-IrishScottishSeminoleSenegaleseSerbianShoshoneSierra LeoneanSiouxSlavicSlovakSloveneSomaliSouth AfricanSouth AmericanSouth American IndianSoviet UnionSpaniardSpanishSpanish AmericanSpanish American IndianSri LankanSubsaharan AfricanSudaneseSwedishSwissSyrianTaiwaneseThaiTlingit-HaidaTohono O'OdhamTonganTrinidadian and TobagonianTsimshianTurkishU.S. Virgin IslanderUgandanUkrainianUruguayanUteVenezuelanVietnameseWelshWest IndianYakamaYaquiYugoslavianYumanYup'ikZimbabwean
Immigration
NonimmigrantsImmigrantsAfghanistanAfricaAlbaniaArgentinaArmeniaAsiaAustraliaAustriaBahamasBangladeshBarbadosBelarusBelgiumBelizeBoliviaBosnia and HerzegovinaBrazilBulgariaBurma/MyanmarCabo VerdeCambodiaCameroonCanadaCaribbeanCentral AmericaChileChinaColombiaCongoCosta RicaCroatiaCubaCzechoslovakiaDenmarkDominicaDominican RepublicEastern AfricaEastern AsiaEastern EuropeEcuadorEgyptEl SalvadorEnglandEritreaEthiopiaFijiFranceGermanyGhanaGreeceGrenadaGuatemalaGuyanaHaitiHondurasHong KongHungaryIndiaIndonesiaIranIraqIrelandIsraelItalyJamaicaJapanJordanKazakhstanKenyaKoreaKuwaitLaosLatin AmericaLatviaLebanonLiberiaLithuaniaMalaysiaMexicoMicronesiaMiddle AfricaMoldovaMoroccoNepalNetherlandsNicaraguaNigeriaNorth AmericaNorth MacedoniaNorthern AfricaNorthern EuropeNorwayOceaniaPakistanPanamaPeruPhilippinesPolandPortugalRomaniaRussiaSaudi ArabiaScotlandSenegalSerbiaSierra LeoneSingaporeSomaliaSouth AfricaSouth AmericaSouth Central AsiaSouth Eastern AsiaSouthern EuropeSpainSri LankaSt. Vincent and the GrenadinesSudanSwedenSwitzerlandSyriaTaiwanThailandTrinidad and TobagoTurkeyUgandaUkraineUruguayUzbekistanVenezuelaVietnamWest IndiesWestern AfricaWestern AsiaWestern EuropeYemenZaireZimbabweAzores
Immigrants from Europe
Race
Ancestry
AfghanAfricanAlaska NativeAlaskan AthabascanAlbanianAleutAlsatianAmericanApacheArabArapahoArgentineanArmenianAssyrian/Chaldean/SyriacAustralianAustrianBahamianBangladeshiBarbadianBasqueBelgianBelizeanBermudanBhutaneseBlackfeetBolivianBrazilianBritishBritish West IndianBulgarianBurmeseCajunCambodianCanadianCape VerdeanCarpatho RusynCelticCentral AmericanCentral American IndianCherokeeCheyenneChickasawChileanChineseChippewaChoctawColombianColvilleComancheCosta RicanCreeCreekCroatianCrowCubanCypriotCzechCzechoslovakianDanishDelawareDominicanDutchDutch West IndianEastern EuropeanEcuadorianEgyptianEnglishEstonianEthiopianEuropeanFijianFilipinoFinnishFrenchFrench American IndianFrench CanadianGermanGerman RussianGhanaianGreekGuamanian/ChamorroGuatemalanGuyaneseHaitianHmongHonduranHopiHoumaHungarianIcelanderIndian (Asian)IndonesianInupiatIranianIraqiIrishIroquoisIsraeliItalianJamaicanJapaneseJordanianKenyanKiowaKoreanLaotianLatvianLebaneseLiberianLithuanianLumbeeLuxembourgerMacedonianMalaysianMalteseMarshalleseMenomineeMexicanMexican American IndianMongolianMoroccanNative HawaiianNavajoNepaleseNew ZealanderNicaraguanNigerianNorthern EuropeanNorwegianOkinawanOsageOttawaPaiutePakistaniPalestinianPanamanianParaguayanPennsylvania GermanPeruvianPimaPolishPortuguesePotawatomiPuebloPuerto RicanPuget Sound SalishRomanianRussianSalvadoranSamoanScandinavianScotch-IrishScottishSeminoleSenegaleseSerbianShoshoneSierra LeoneanSiouxSlavicSlovakSloveneSomaliSouth AfricanSouth AmericanSouth American IndianSoviet UnionSpaniardSpanishSpanish AmericanSpanish American IndianSri LankanSubsaharan AfricanSudaneseSwedishSwissSyrianTaiwaneseThaiTlingit-HaidaTohono O'OdhamTonganTrinidadian and TobagonianTsimshianTurkishU.S. Virgin IslanderUgandanUkrainianUruguayanUteVenezuelanVietnameseWelshWest IndianYakamaYaquiYugoslavianYumanYup'ikZimbabwean
Immigration
NonimmigrantsImmigrantsAfghanistanAfricaAlbaniaArgentinaArmeniaAsiaAustraliaAustriaBahamasBangladeshBarbadosBelarusBelgiumBelizeBoliviaBosnia and HerzegovinaBrazilBulgariaBurma/MyanmarCabo VerdeCambodiaCameroonCanadaCaribbeanCentral AmericaChileChinaColombiaCongoCosta RicaCroatiaCubaCzechoslovakiaDenmarkDominicaDominican RepublicEastern AfricaEastern AsiaEastern EuropeEcuadorEgyptEl SalvadorEnglandEritreaEthiopiaEuropeFijiFranceGermanyGhanaGreeceGrenadaGuatemalaGuyanaHaitiHondurasHong KongHungaryIndiaIndonesiaIranIraqIrelandIsraelItalyJamaicaJapanJordanKazakhstanKenyaKoreaKuwaitLaosLatin AmericaLatviaLebanonLiberiaLithuaniaMalaysiaMexicoMicronesiaMiddle AfricaMoldovaMoroccoNepalNetherlandsNicaraguaNigeriaNorth AmericaNorth MacedoniaNorthern AfricaNorthern EuropeNorwayOceaniaPakistanPanamaPeruPhilippinesPolandPortugalRomaniaRussiaSaudi ArabiaScotlandSenegalSerbiaSierra LeoneSingaporeSomaliaSouth AfricaSouth AmericaSouth Central AsiaSouth Eastern AsiaSouthern EuropeSpainSri LankaSt. Vincent and the GrenadinesSudanSwedenSwitzerlandSyriaTaiwanThailandTrinidad and TobagoTurkeyUgandaUkraineUruguayUzbekistanVenezuelaVietnamWest IndiesWestern AfricaWestern AsiaWestern EuropeYemenZaireZimbabweAzores
In Labor Force | Age 20-64
Income
Poverty
Unemployment
Labor Participation
Family Structure
Vehicle Availability
Education Level
Disability

In Labor Force | Age 20-64 Comparison

Asians

Immigrants from Europe

Exceptional
Exceptional
80.2%
IN LABOR FORCE | AGE 20-64
97.7/ 100
METRIC RATING
79th/ 347
METRIC RANK
79.9%
IN LABOR FORCE | AGE 20-64
91.6/ 100
METRIC RATING
124th/ 347
METRIC RANK

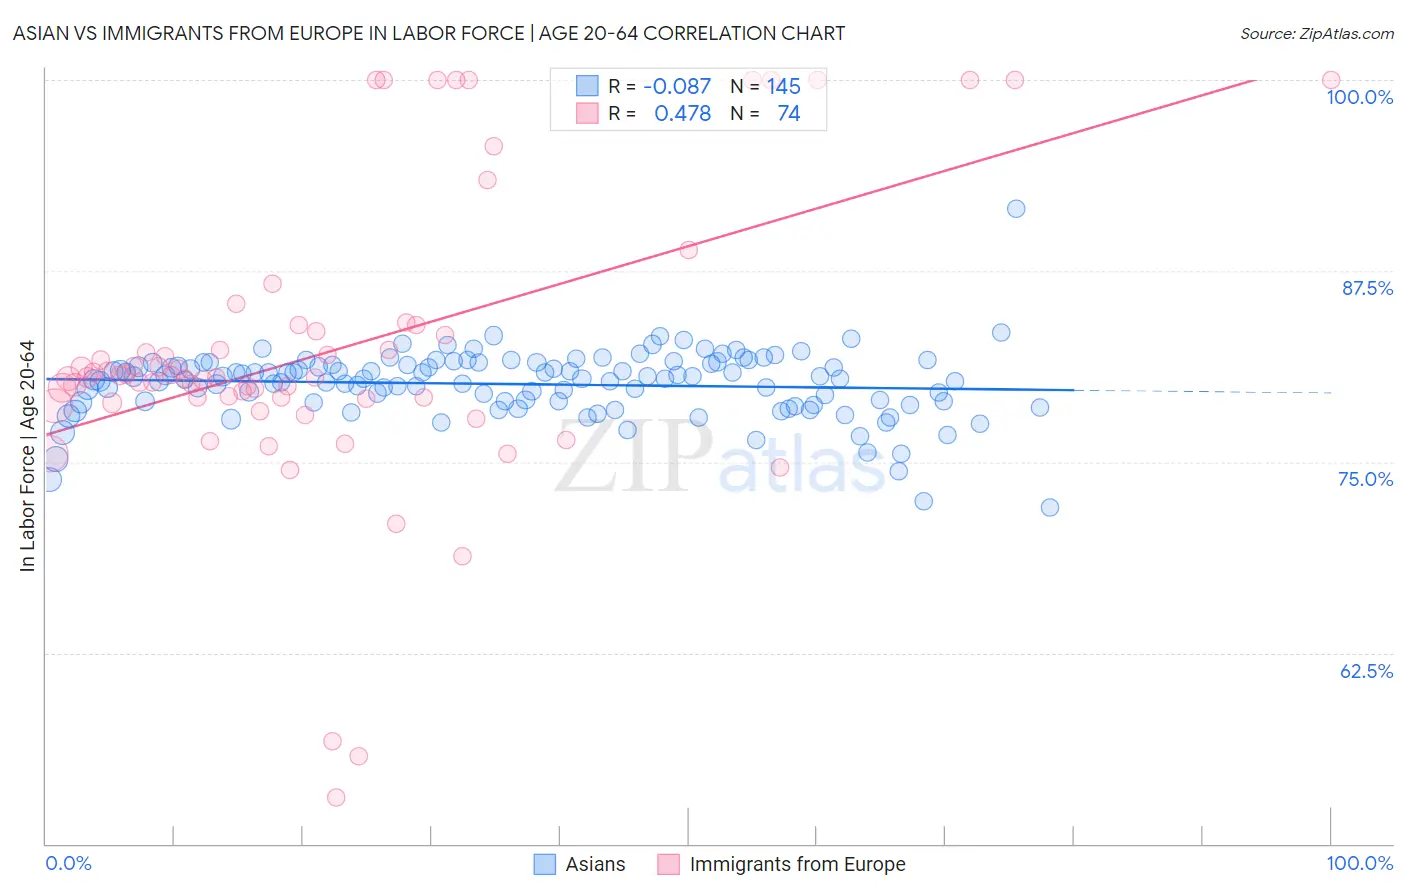
Asian vs Immigrants from Europe In Labor Force | Age 20-64 Correlation Chart

The statistical analysis conducted on geographies consisting of 550,934,136 people shows a slight negative correlation between the proportion of Asians and labor force participation rate among population between the ages 20 and 64 in the United States with a correlation coefficient (R) of -0.087 and weighted average of 80.2%. Similarly, the statistical analysis conducted on geographies consisting of 547,427,342 people shows a moderate positive correlation between the proportion of Immigrants from Europe and labor force participation rate among population between the ages 20 and 64 in the United States with a correlation coefficient (R) of 0.478 and weighted average of 79.9%, a difference of 0.27%.
Asian vs Immigrants from Europe In Labor Force | Age 20-64

In Labor Force | Age 20-64 Correlation Summary

MeasurementAsianImmigrants from Europe
Minimum72.0%53.0%
Maximum91.6%100.0%
Range19.6%47.0%
Mean80.1%82.3%
Median80.5%80.5%
Interquartile 25% (IQ1)78.9%79.2%
Interquartile 75% (IQ3)81.4%83.9%
Interquartile Range (IQR)2.5%4.8%
Standard Deviation (Sample)2.2%9.7%
Standard Deviation (Population)2.2%9.7%

Similar Demographics by In Labor Force | Age 20-64

Demographics Similar to Asians by In Labor Force | Age 20-64

In terms of in labor force | age 20-64, the demographic groups most similar to Asians are Egyptian (80.2%, a difference of 0.010%), Immigrants from Colombia (80.2%, a difference of 0.010%), Immigrants from Romania (80.2%, a difference of 0.010%), Immigrants from Croatia (80.1%, a difference of 0.010%), and Immigrants from Afghanistan (80.2%, a difference of 0.030%).
DemographicsRating | RankIn Labor Force | Age 20-64
Eastern Europeans
98.4
/100
|
#72
Exceptional
80.2%
Cypriots
98.2
/100
|
#73
Exceptional
80.2%
Immigrants | Eastern Europe
98.1
/100
|
#74
Exceptional
80.2%
Immigrants | Afghanistan
97.9
/100
|
#75
Exceptional
80.2%
Egyptians
97.8
/100
|
#76
Exceptional
80.2%
Immigrants | Colombia
97.8
/100
|
#77
Exceptional
80.2%
Immigrants | Romania
97.8
/100
|
#78
Exceptional
80.2%
Asians
97.7
/100
|
#79
Exceptional
80.2%
Immigrants | Croatia
97.6
/100
|
#80
Exceptional
80.1%
German Russians
97.3
/100
|
#81
Exceptional
80.1%
Immigrants | Japan
97.3
/100
|
#82
Exceptional
80.1%
Colombians
97.3
/100
|
#83
Exceptional
80.1%
Immigrants | Latvia
97.2
/100
|
#84
Exceptional
80.1%
Jordanians
97.2
/100
|
#85
Exceptional
80.1%
Immigrants | Egypt
97.1
/100
|
#86
Exceptional
80.1%

Demographics Similar to Immigrants from Europe by In Labor Force | Age 20-64

In terms of in labor force | age 20-64, the demographic groups most similar to Immigrants from Europe are Immigrants from Russia (79.9%, a difference of 0.0%), Danish (79.9%, a difference of 0.0%), Mongolian (79.9%, a difference of 0.010%), Immigrants from Taiwan (80.0%, a difference of 0.020%), and Maltese (80.0%, a difference of 0.020%).
DemographicsRating | RankIn Labor Force | Age 20-64
Immigrants | Vietnam
92.7
/100
|
#117
Exceptional
80.0%
Cape Verdeans
92.7
/100
|
#118
Exceptional
80.0%
Immigrants | Taiwan
92.5
/100
|
#119
Exceptional
80.0%
Maltese
92.4
/100
|
#120
Exceptional
80.0%
Immigrants | Kuwait
92.2
/100
|
#121
Exceptional
80.0%
Mongolians
92.0
/100
|
#122
Exceptional
79.9%
Immigrants | Russia
91.8
/100
|
#123
Exceptional
79.9%
Immigrants | Europe
91.6
/100
|
#124
Exceptional
79.9%
Danes
91.5
/100
|
#125
Exceptional
79.9%
Immigrants | France
90.7
/100
|
#126
Exceptional
79.9%
Immigrants | Czechoslovakia
89.7
/100
|
#127
Excellent
79.9%
Immigrants | Eastern Asia
89.4
/100
|
#128
Excellent
79.9%
Italians
88.9
/100
|
#129
Excellent
79.9%
Immigrants | Zaire
88.6
/100
|
#130
Excellent
79.9%
Immigrants | Iran
88.3
/100
|
#131
Excellent
79.9%