Okinawan vs Immigrants from Europe In Labor Force | Age 20-64
COMPARE
Okinawan
Immigrants from Europe
In Labor Force | Age 20-64
In Labor Force | Age 20-64 Comparison
Okinawans
Immigrants from Europe
79.6%
IN LABOR FORCE | AGE 20-64
62.7/ 100
METRIC RATING
166th/ 347
METRIC RANK
79.9%
IN LABOR FORCE | AGE 20-64
91.6/ 100
METRIC RATING
124th/ 347
METRIC RANK
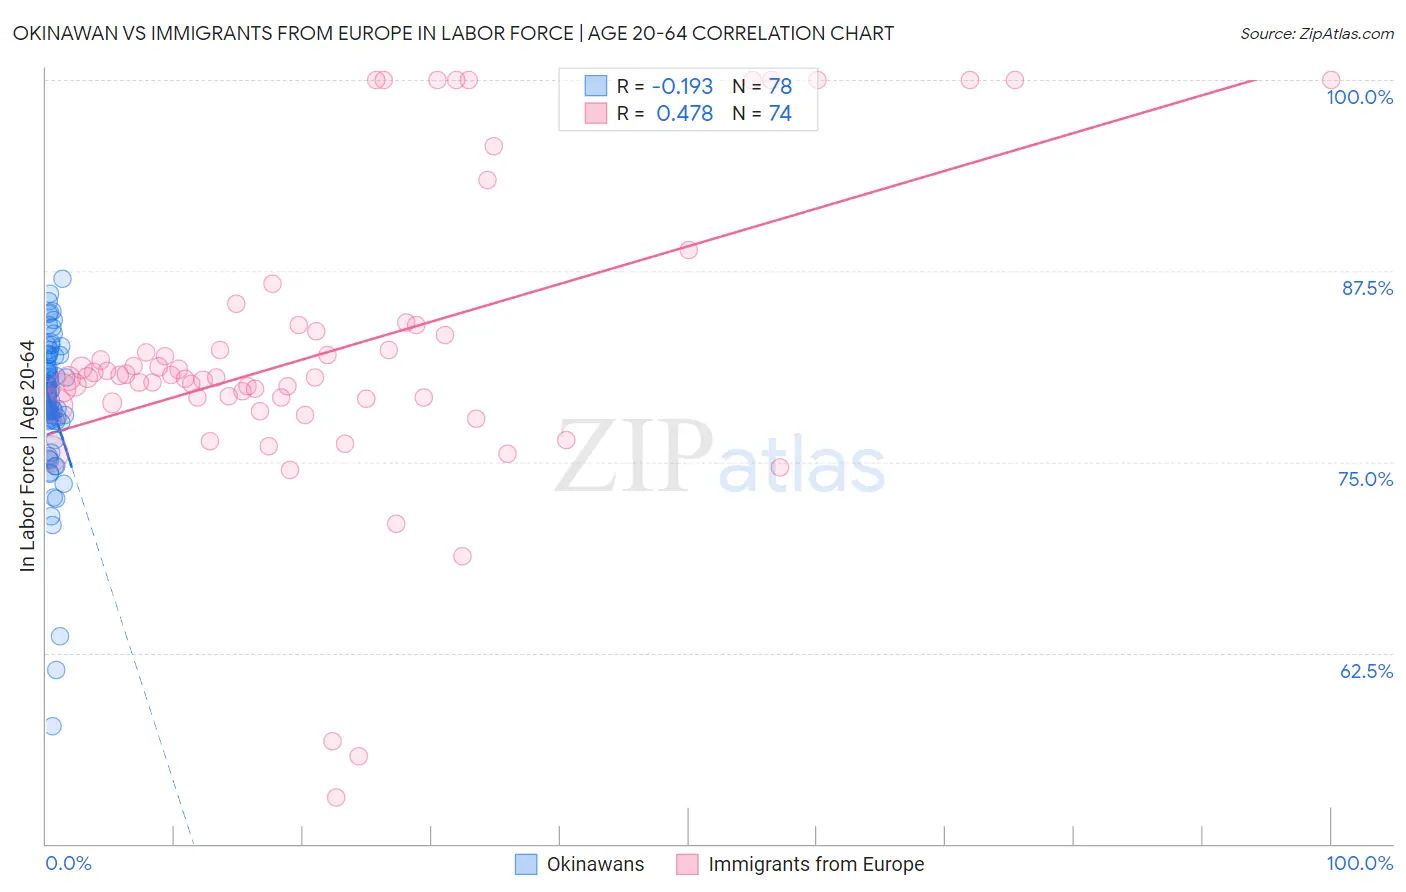
Okinawan vs Immigrants from Europe In Labor Force | Age 20-64 Correlation Chart
The statistical analysis conducted on geographies consisting of 73,775,632 people shows a poor negative correlation between the proportion of Okinawans and labor force participation rate among population between the ages 20 and 64 in the United States with a correlation coefficient (R) of -0.193 and weighted average of 79.6%. Similarly, the statistical analysis conducted on geographies consisting of 547,427,342 people shows a moderate positive correlation between the proportion of Immigrants from Europe and labor force participation rate among population between the ages 20 and 64 in the United States with a correlation coefficient (R) of 0.478 and weighted average of 79.9%, a difference of 0.38%.
In Labor Force | Age 20-64 Correlation Summary
| Measurement | Okinawan | Immigrants from Europe |
| Minimum | 57.7% | 53.0% |
| Maximum | 87.0% | 100.0% |
| Range | 29.3% | 47.0% |
| Mean | 78.7% | 82.3% |
| Median | 79.4% | 80.5% |
| Interquartile 25% (IQ1) | 77.7% | 79.2% |
| Interquartile 75% (IQ3) | 81.9% | 83.9% |
| Interquartile Range (IQR) | 4.2% | 4.8% |
| Standard Deviation (Sample) | 5.0% | 9.7% |
| Standard Deviation (Population) | 4.9% | 9.7% |
Similar Demographics by In Labor Force | Age 20-64
Demographics Similar to Okinawans by In Labor Force | Age 20-64
In terms of in labor force | age 20-64, the demographic groups most similar to Okinawans are Immigrants from Burma/Myanmar (79.7%, a difference of 0.010%), Nigerian (79.7%, a difference of 0.010%), Immigrants from Iraq (79.6%, a difference of 0.010%), Immigrants from Indonesia (79.6%, a difference of 0.010%), and German (79.7%, a difference of 0.020%).
| Demographics | Rating | Rank | In Labor Force | Age 20-64 |
| Immigrants | Cuba | 66.7 /100 | #159 | Good 79.7% |
| Moroccans | 66.7 /100 | #160 | Good 79.7% |
| South Africans | 66.2 /100 | #161 | Good 79.7% |
| Germans | 65.2 /100 | #162 | Good 79.7% |
| Immigrants | Costa Rica | 64.6 /100 | #163 | Good 79.7% |
| Immigrants | Burma/Myanmar | 64.4 /100 | #164 | Good 79.7% |
| Nigerians | 64.0 /100 | #165 | Good 79.7% |
| Okinawans | 62.7 /100 | #166 | Good 79.6% |
| Immigrants | Iraq | 62.0 /100 | #167 | Good 79.6% |
| Immigrants | Indonesia | 61.8 /100 | #168 | Good 79.6% |
| Laotians | 58.4 /100 | #169 | Average 79.6% |
| Slavs | 54.0 /100 | #170 | Average 79.6% |
| Immigrants | Switzerland | 53.3 /100 | #171 | Average 79.6% |
| Immigrants | Belgium | 53.1 /100 | #172 | Average 79.6% |
| Immigrants | Scotland | 52.4 /100 | #173 | Average 79.6% |
Demographics Similar to Immigrants from Europe by In Labor Force | Age 20-64
In terms of in labor force | age 20-64, the demographic groups most similar to Immigrants from Europe are Immigrants from Russia (79.9%, a difference of 0.0%), Danish (79.9%, a difference of 0.0%), Mongolian (79.9%, a difference of 0.010%), Immigrants from Taiwan (80.0%, a difference of 0.020%), and Maltese (80.0%, a difference of 0.020%).
| Demographics | Rating | Rank | In Labor Force | Age 20-64 |
| Immigrants | Vietnam | 92.7 /100 | #117 | Exceptional 80.0% |
| Cape Verdeans | 92.7 /100 | #118 | Exceptional 80.0% |
| Immigrants | Taiwan | 92.5 /100 | #119 | Exceptional 80.0% |
| Maltese | 92.4 /100 | #120 | Exceptional 80.0% |
| Immigrants | Kuwait | 92.2 /100 | #121 | Exceptional 80.0% |
| Mongolians | 92.0 /100 | #122 | Exceptional 79.9% |
| Immigrants | Russia | 91.8 /100 | #123 | Exceptional 79.9% |
| Immigrants | Europe | 91.6 /100 | #124 | Exceptional 79.9% |
| Danes | 91.5 /100 | #125 | Exceptional 79.9% |
| Immigrants | France | 90.7 /100 | #126 | Exceptional 79.9% |
| Immigrants | Czechoslovakia | 89.7 /100 | #127 | Excellent 79.9% |
| Immigrants | Eastern Asia | 89.4 /100 | #128 | Excellent 79.9% |
| Italians | 88.9 /100 | #129 | Excellent 79.9% |
| Immigrants | Zaire | 88.6 /100 | #130 | Excellent 79.9% |
| Immigrants | Iran | 88.3 /100 | #131 | Excellent 79.9% |