Immigrants from Bahamas vs Hungarian In Labor Force | Age 20-64
COMPARE
Immigrants from Bahamas
Hungarian
In Labor Force | Age 20-64
In Labor Force | Age 20-64 Comparison
Immigrants from Bahamas
Hungarians
78.2%
IN LABOR FORCE | AGE 20-64
0.0/ 100
METRIC RATING
277th/ 347
METRIC RANK
79.2%
IN LABOR FORCE | AGE 20-64
7.2/ 100
METRIC RATING
221st/ 347
METRIC RANK
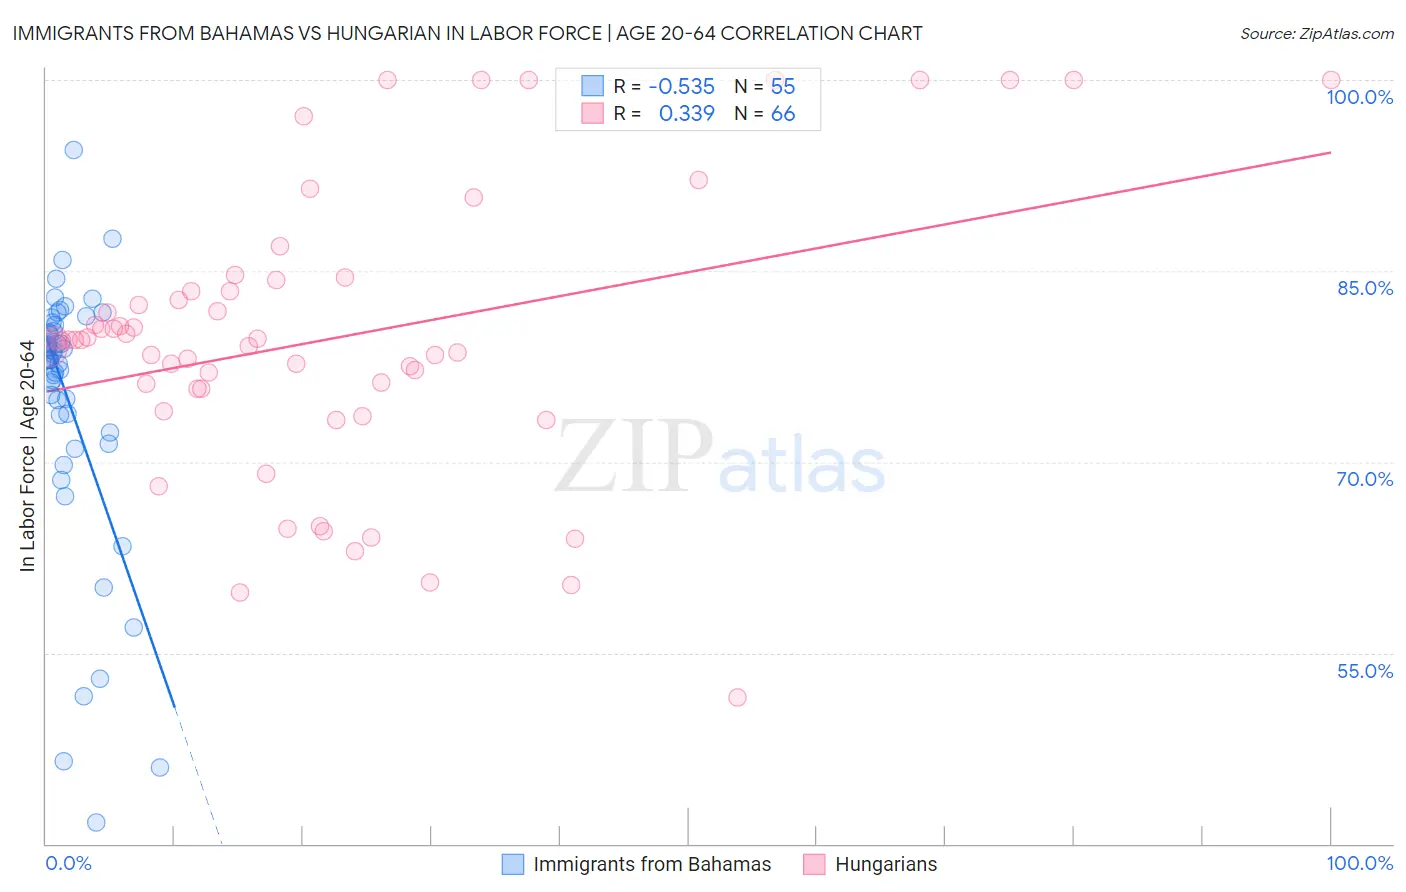
Immigrants from Bahamas vs Hungarian In Labor Force | Age 20-64 Correlation Chart
The statistical analysis conducted on geographies consisting of 104,666,072 people shows a substantial negative correlation between the proportion of Immigrants from Bahamas and labor force participation rate among population between the ages 20 and 64 in the United States with a correlation coefficient (R) of -0.535 and weighted average of 78.2%. Similarly, the statistical analysis conducted on geographies consisting of 486,244,384 people shows a mild positive correlation between the proportion of Hungarians and labor force participation rate among population between the ages 20 and 64 in the United States with a correlation coefficient (R) of 0.339 and weighted average of 79.2%, a difference of 1.2%.
In Labor Force | Age 20-64 Correlation Summary
| Measurement | Immigrants from Bahamas | Hungarian |
| Minimum | 41.7% | 51.5% |
| Maximum | 94.5% | 100.0% |
| Range | 52.8% | 48.5% |
| Mean | 74.7% | 79.7% |
| Median | 78.0% | 79.6% |
| Interquartile 25% (IQ1) | 72.3% | 75.8% |
| Interquartile 75% (IQ3) | 80.8% | 83.4% |
| Interquartile Range (IQR) | 8.5% | 7.6% |
| Standard Deviation (Sample) | 10.7% | 11.1% |
| Standard Deviation (Population) | 10.6% | 11.1% |
Similar Demographics by In Labor Force | Age 20-64
Demographics Similar to Immigrants from Bahamas by In Labor Force | Age 20-64
In terms of in labor force | age 20-64, the demographic groups most similar to Immigrants from Bahamas are Mexican American Indian (78.2%, a difference of 0.0%), Puget Sound Salish (78.2%, a difference of 0.010%), Aleut (78.2%, a difference of 0.020%), Spanish (78.2%, a difference of 0.020%), and French American Indian (78.2%, a difference of 0.050%).
| Demographics | Rating | Rank | In Labor Force | Age 20-64 |
| Scotch-Irish | 0.0 /100 | #270 | Tragic 78.3% |
| Immigrants | Latin America | 0.0 /100 | #271 | Tragic 78.3% |
| Marshallese | 0.0 /100 | #272 | Tragic 78.3% |
| French American Indians | 0.0 /100 | #273 | Tragic 78.2% |
| Aleuts | 0.0 /100 | #274 | Tragic 78.2% |
| Spanish | 0.0 /100 | #275 | Tragic 78.2% |
| Puget Sound Salish | 0.0 /100 | #276 | Tragic 78.2% |
| Immigrants | Bahamas | 0.0 /100 | #277 | Tragic 78.2% |
| Mexican American Indians | 0.0 /100 | #278 | Tragic 78.2% |
| Belizeans | 0.0 /100 | #279 | Tragic 78.2% |
| Immigrants | Dominica | 0.0 /100 | #280 | Tragic 78.1% |
| Guyanese | 0.0 /100 | #281 | Tragic 78.1% |
| Immigrants | St. Vincent and the Grenadines | 0.0 /100 | #282 | Tragic 78.1% |
| Immigrants | Nonimmigrants | 0.0 /100 | #283 | Tragic 78.1% |
| Immigrants | Guyana | 0.0 /100 | #284 | Tragic 78.1% |
Demographics Similar to Hungarians by In Labor Force | Age 20-64
In terms of in labor force | age 20-64, the demographic groups most similar to Hungarians are Immigrants (79.2%, a difference of 0.010%), Immigrants from Panama (79.1%, a difference of 0.010%), Canadian (79.1%, a difference of 0.010%), Immigrants from Uzbekistan (79.1%, a difference of 0.010%), and French Canadian (79.2%, a difference of 0.030%).
| Demographics | Rating | Rank | In Labor Force | Age 20-64 |
| Immigrants | Armenia | 12.2 /100 | #214 | Poor 79.2% |
| Immigrants | Norway | 12.0 /100 | #215 | Poor 79.2% |
| Arabs | 11.4 /100 | #216 | Poor 79.2% |
| Immigrants | Western Asia | 11.0 /100 | #217 | Poor 79.2% |
| Immigrants | England | 9.3 /100 | #218 | Tragic 79.2% |
| French Canadians | 8.4 /100 | #219 | Tragic 79.2% |
| Immigrants | Immigrants | 7.7 /100 | #220 | Tragic 79.2% |
| Hungarians | 7.2 /100 | #221 | Tragic 79.2% |
| Immigrants | Panama | 6.9 /100 | #222 | Tragic 79.1% |
| Canadians | 6.8 /100 | #223 | Tragic 79.1% |
| Immigrants | Uzbekistan | 6.8 /100 | #224 | Tragic 79.1% |
| Portuguese | 6.4 /100 | #225 | Tragic 79.1% |
| Central Americans | 5.9 /100 | #226 | Tragic 79.1% |
| Immigrants | Western Europe | 5.9 /100 | #227 | Tragic 79.1% |
| Panamanians | 5.7 /100 | #228 | Tragic 79.1% |