European vs Immigrants from Europe In Labor Force | Age 20-64
COMPARE
European
Immigrants from Europe
In Labor Force | Age 20-64
In Labor Force | Age 20-64 Comparison
Europeans
Immigrants from Europe
79.3%
IN LABOR FORCE | AGE 20-64
15.3/ 100
METRIC RATING
211th/ 347
METRIC RANK
79.9%
IN LABOR FORCE | AGE 20-64
91.6/ 100
METRIC RATING
124th/ 347
METRIC RANK
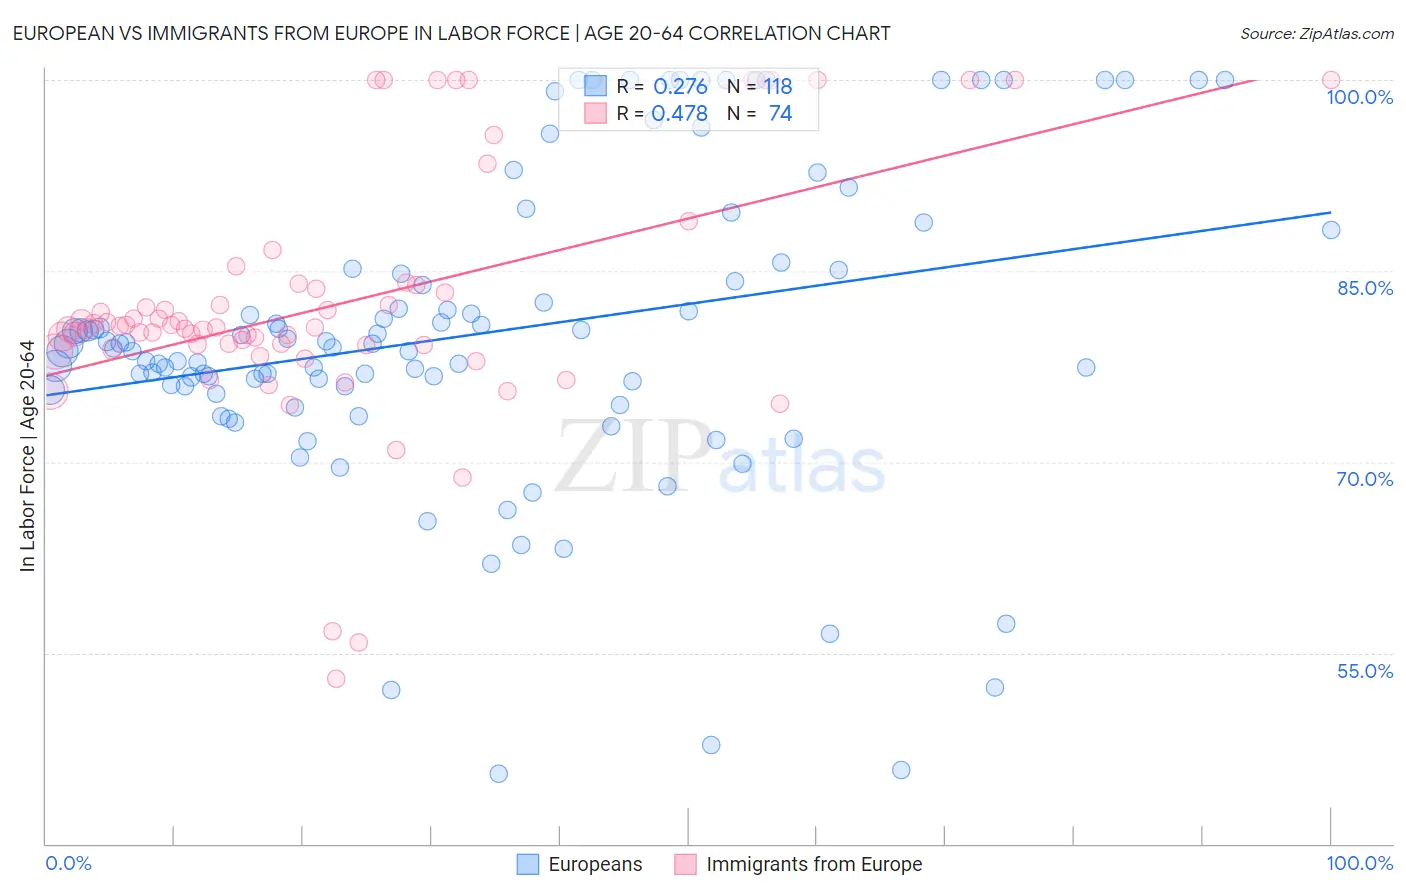
European vs Immigrants from Europe In Labor Force | Age 20-64 Correlation Chart
The statistical analysis conducted on geographies consisting of 561,836,944 people shows a weak positive correlation between the proportion of Europeans and labor force participation rate among population between the ages 20 and 64 in the United States with a correlation coefficient (R) of 0.276 and weighted average of 79.3%. Similarly, the statistical analysis conducted on geographies consisting of 547,427,342 people shows a moderate positive correlation between the proportion of Immigrants from Europe and labor force participation rate among population between the ages 20 and 64 in the United States with a correlation coefficient (R) of 0.478 and weighted average of 79.9%, a difference of 0.83%.
In Labor Force | Age 20-64 Correlation Summary
| Measurement | European | Immigrants from Europe |
| Minimum | 45.5% | 53.0% |
| Maximum | 100.0% | 100.0% |
| Range | 54.5% | 47.0% |
| Mean | 80.1% | 82.3% |
| Median | 79.1% | 80.5% |
| Interquartile 25% (IQ1) | 76.0% | 79.2% |
| Interquartile 75% (IQ3) | 85.1% | 83.9% |
| Interquartile Range (IQR) | 9.1% | 4.8% |
| Standard Deviation (Sample) | 12.1% | 9.7% |
| Standard Deviation (Population) | 12.1% | 9.7% |
Similar Demographics by In Labor Force | Age 20-64
Demographics Similar to Europeans by In Labor Force | Age 20-64
In terms of in labor force | age 20-64, the demographic groups most similar to Europeans are Haitian (79.3%, a difference of 0.010%), Immigrants from Ecuador (79.3%, a difference of 0.020%), Subsaharan African (79.3%, a difference of 0.020%), British (79.3%, a difference of 0.020%), and Bangladeshi (79.3%, a difference of 0.020%).
| Demographics | Rating | Rank | In Labor Force | Age 20-64 |
| Immigrants | Cambodia | 17.6 /100 | #204 | Poor 79.3% |
| Immigrants | Congo | 17.5 /100 | #205 | Poor 79.3% |
| Immigrants | Ecuador | 16.9 /100 | #206 | Poor 79.3% |
| Sub-Saharan Africans | 16.5 /100 | #207 | Poor 79.3% |
| British | 16.5 /100 | #208 | Poor 79.3% |
| Bangladeshis | 16.4 /100 | #209 | Poor 79.3% |
| Haitians | 16.1 /100 | #210 | Poor 79.3% |
| Europeans | 15.3 /100 | #211 | Poor 79.3% |
| Irish | 13.2 /100 | #212 | Poor 79.3% |
| Immigrants | Portugal | 12.8 /100 | #213 | Poor 79.3% |
| Immigrants | Armenia | 12.2 /100 | #214 | Poor 79.2% |
| Immigrants | Norway | 12.0 /100 | #215 | Poor 79.2% |
| Arabs | 11.4 /100 | #216 | Poor 79.2% |
| Immigrants | Western Asia | 11.0 /100 | #217 | Poor 79.2% |
| Immigrants | England | 9.3 /100 | #218 | Tragic 79.2% |
Demographics Similar to Immigrants from Europe by In Labor Force | Age 20-64
In terms of in labor force | age 20-64, the demographic groups most similar to Immigrants from Europe are Immigrants from Russia (79.9%, a difference of 0.0%), Danish (79.9%, a difference of 0.0%), Mongolian (79.9%, a difference of 0.010%), Immigrants from Taiwan (80.0%, a difference of 0.020%), and Maltese (80.0%, a difference of 0.020%).
| Demographics | Rating | Rank | In Labor Force | Age 20-64 |
| Immigrants | Vietnam | 92.7 /100 | #117 | Exceptional 80.0% |
| Cape Verdeans | 92.7 /100 | #118 | Exceptional 80.0% |
| Immigrants | Taiwan | 92.5 /100 | #119 | Exceptional 80.0% |
| Maltese | 92.4 /100 | #120 | Exceptional 80.0% |
| Immigrants | Kuwait | 92.2 /100 | #121 | Exceptional 80.0% |
| Mongolians | 92.0 /100 | #122 | Exceptional 79.9% |
| Immigrants | Russia | 91.8 /100 | #123 | Exceptional 79.9% |
| Immigrants | Europe | 91.6 /100 | #124 | Exceptional 79.9% |
| Danes | 91.5 /100 | #125 | Exceptional 79.9% |
| Immigrants | France | 90.7 /100 | #126 | Exceptional 79.9% |
| Immigrants | Czechoslovakia | 89.7 /100 | #127 | Excellent 79.9% |
| Immigrants | Eastern Asia | 89.4 /100 | #128 | Excellent 79.9% |
| Italians | 88.9 /100 | #129 | Excellent 79.9% |
| Immigrants | Zaire | 88.6 /100 | #130 | Excellent 79.9% |
| Immigrants | Iran | 88.3 /100 | #131 | Excellent 79.9% |