Immigrants from Bahamas vs Hungarian Divorced or Separated
COMPARE
Immigrants from Bahamas
Hungarian
Divorced or Separated
Divorced or Separated Comparison
Immigrants from Bahamas
Hungarians
13.9%
DIVORCED OR SEPARATED
0.0/ 100
METRIC RATING
334th/ 347
METRIC RANK
12.0%
DIVORCED OR SEPARATED
70.3/ 100
METRIC RATING
156th/ 347
METRIC RANK
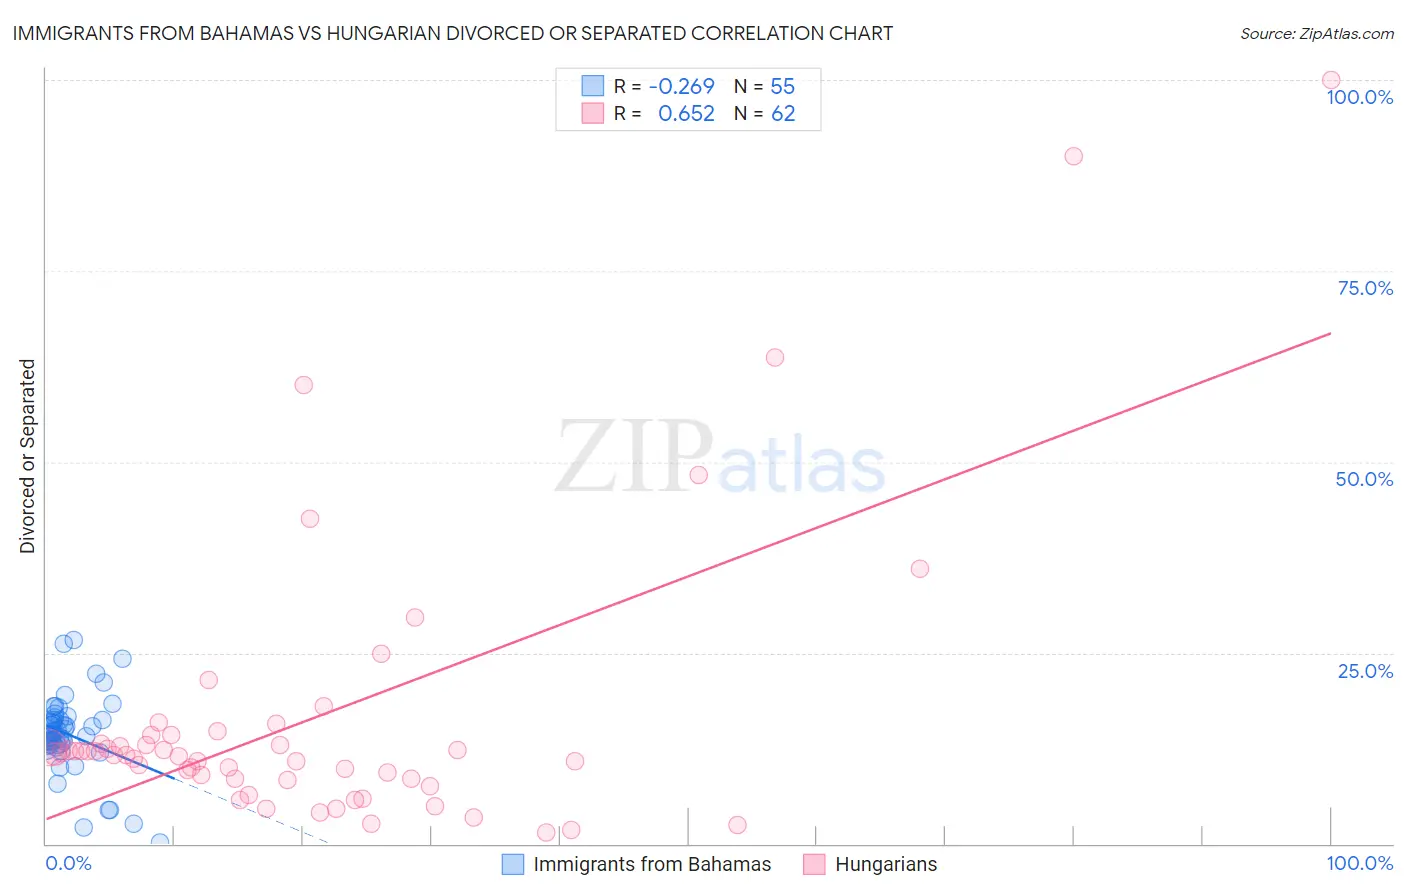
Immigrants from Bahamas vs Hungarian Divorced or Separated Correlation Chart
The statistical analysis conducted on geographies consisting of 104,629,880 people shows a weak negative correlation between the proportion of Immigrants from Bahamas and percentage of population currently divorced or separated in the United States with a correlation coefficient (R) of -0.269 and weighted average of 13.9%. Similarly, the statistical analysis conducted on geographies consisting of 485,998,803 people shows a significant positive correlation between the proportion of Hungarians and percentage of population currently divorced or separated in the United States with a correlation coefficient (R) of 0.652 and weighted average of 12.0%, a difference of 16.2%.
Divorced or Separated Correlation Summary
| Measurement | Immigrants from Bahamas | Hungarian |
| Minimum | 0.20% | 1.4% |
| Maximum | 26.7% | 100.0% |
| Range | 26.5% | 98.6% |
| Mean | 14.3% | 16.6% |
| Median | 14.1% | 11.7% |
| Interquartile 25% (IQ1) | 12.9% | 8.5% |
| Interquartile 75% (IQ3) | 16.3% | 14.2% |
| Interquartile Range (IQR) | 3.3% | 5.8% |
| Standard Deviation (Sample) | 5.1% | 19.0% |
| Standard Deviation (Population) | 5.1% | 18.8% |
Similar Demographics by Divorced or Separated
Demographics Similar to Immigrants from Bahamas by Divorced or Separated
In terms of divorced or separated, the demographic groups most similar to Immigrants from Bahamas are Puerto Rican (13.9%, a difference of 0.34%), Dutch West Indian (14.0%, a difference of 0.60%), Shoshone (14.0%, a difference of 0.95%), Crow (14.1%, a difference of 1.2%), and Cherokee (13.7%, a difference of 1.3%).
| Demographics | Rating | Rank | Divorced or Separated |
| Comanche | 0.0 /100 | #327 | Tragic 13.5% |
| Immigrants | Caribbean | 0.0 /100 | #328 | Tragic 13.6% |
| Houma | 0.0 /100 | #329 | Tragic 13.6% |
| Paiute | 0.0 /100 | #330 | Tragic 13.6% |
| Blacks/African Americans | 0.0 /100 | #331 | Tragic 13.6% |
| Cherokee | 0.0 /100 | #332 | Tragic 13.7% |
| Puerto Ricans | 0.0 /100 | #333 | Tragic 13.9% |
| Immigrants | Bahamas | 0.0 /100 | #334 | Tragic 13.9% |
| Dutch West Indians | 0.0 /100 | #335 | Tragic 14.0% |
| Shoshone | 0.0 /100 | #336 | Tragic 14.0% |
| Crow | 0.0 /100 | #337 | Tragic 14.1% |
| Choctaw | 0.0 /100 | #338 | Tragic 14.1% |
| Colville | 0.0 /100 | #339 | Tragic 14.2% |
| Chickasaw | 0.0 /100 | #340 | Tragic 14.2% |
| Bahamians | 0.0 /100 | #341 | Tragic 14.2% |
Demographics Similar to Hungarians by Divorced or Separated
In terms of divorced or separated, the demographic groups most similar to Hungarians are Japanese (12.0%, a difference of 0.020%), Chilean (12.0%, a difference of 0.040%), Immigrants from Brazil (12.0%, a difference of 0.060%), Austrian (12.0%, a difference of 0.080%), and Immigrants from Hungary (11.9%, a difference of 0.15%).
| Demographics | Rating | Rank | Divorced or Separated |
| Immigrants | Oceania | 77.7 /100 | #149 | Good 11.9% |
| Immigrants | Portugal | 77.3 /100 | #150 | Good 11.9% |
| Czechs | 76.4 /100 | #151 | Good 11.9% |
| Immigrants | Hungary | 73.7 /100 | #152 | Good 11.9% |
| Austrians | 72.2 /100 | #153 | Good 12.0% |
| Chileans | 71.3 /100 | #154 | Good 12.0% |
| Japanese | 70.9 /100 | #155 | Good 12.0% |
| Hungarians | 70.3 /100 | #156 | Good 12.0% |
| Immigrants | Brazil | 68.8 /100 | #157 | Good 12.0% |
| Icelanders | 66.0 /100 | #158 | Good 12.0% |
| Immigrants | Barbados | 66.0 /100 | #159 | Good 12.0% |
| Immigrants | Scotland | 65.8 /100 | #160 | Good 12.0% |
| Marshallese | 64.6 /100 | #161 | Good 12.0% |
| Samoans | 64.3 /100 | #162 | Good 12.0% |
| Navajo | 63.9 /100 | #163 | Good 12.0% |