Immigrants from Mexico vs Hungarian In Labor Force | Age 20-64
COMPARE
Immigrants from Mexico
Hungarian
In Labor Force | Age 20-64
In Labor Force | Age 20-64 Comparison
Immigrants from Mexico
Hungarians
77.3%
IN LABOR FORCE | AGE 20-64
0.0/ 100
METRIC RATING
304th/ 347
METRIC RANK
79.2%
IN LABOR FORCE | AGE 20-64
7.2/ 100
METRIC RATING
221st/ 347
METRIC RANK
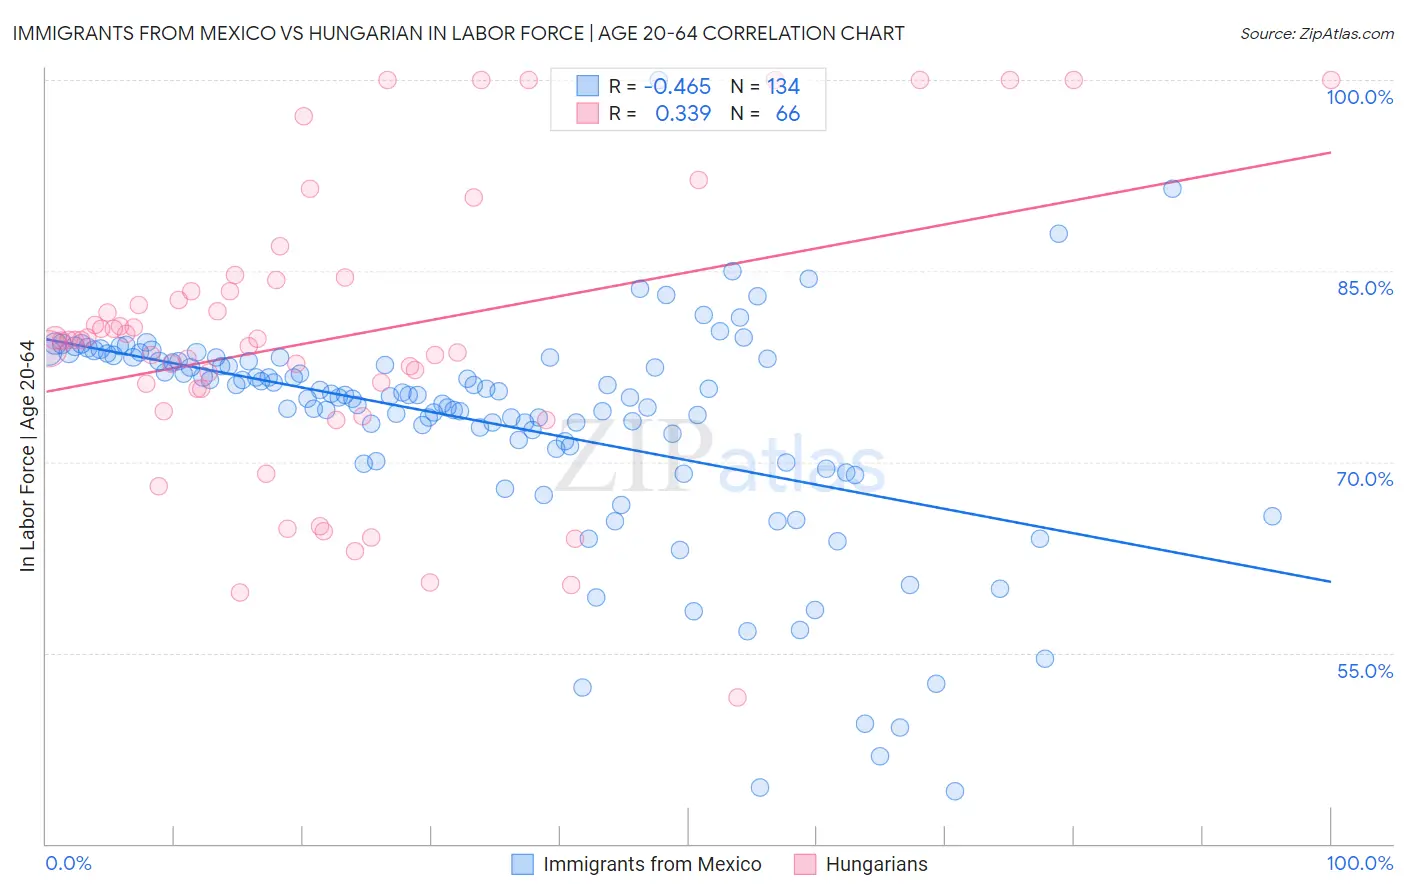
Immigrants from Mexico vs Hungarian In Labor Force | Age 20-64 Correlation Chart
The statistical analysis conducted on geographies consisting of 513,715,618 people shows a moderate negative correlation between the proportion of Immigrants from Mexico and labor force participation rate among population between the ages 20 and 64 in the United States with a correlation coefficient (R) of -0.465 and weighted average of 77.3%. Similarly, the statistical analysis conducted on geographies consisting of 486,244,384 people shows a mild positive correlation between the proportion of Hungarians and labor force participation rate among population between the ages 20 and 64 in the United States with a correlation coefficient (R) of 0.339 and weighted average of 79.2%, a difference of 2.5%.
In Labor Force | Age 20-64 Correlation Summary
| Measurement | Immigrants from Mexico | Hungarian |
| Minimum | 44.1% | 51.5% |
| Maximum | 100.0% | 100.0% |
| Range | 55.9% | 48.5% |
| Mean | 73.0% | 79.7% |
| Median | 75.2% | 79.6% |
| Interquartile 25% (IQ1) | 71.0% | 75.8% |
| Interquartile 75% (IQ3) | 78.1% | 83.4% |
| Interquartile Range (IQR) | 7.1% | 7.6% |
| Standard Deviation (Sample) | 8.8% | 11.1% |
| Standard Deviation (Population) | 8.7% | 11.1% |
Similar Demographics by In Labor Force | Age 20-64
Demographics Similar to Immigrants from Mexico by In Labor Force | Age 20-64
In terms of in labor force | age 20-64, the demographic groups most similar to Immigrants from Mexico are Mexican (77.2%, a difference of 0.040%), Potawatomi (77.2%, a difference of 0.060%), Chippewa (77.3%, a difference of 0.070%), Central American Indian (77.1%, a difference of 0.23%), and Alaska Native (77.0%, a difference of 0.28%).
| Demographics | Rating | Rank | In Labor Force | Age 20-64 |
| Dominicans | 0.0 /100 | #297 | Tragic 77.7% |
| Cree | 0.0 /100 | #298 | Tragic 77.7% |
| Hispanics or Latinos | 0.0 /100 | #299 | Tragic 77.6% |
| Spanish American Indians | 0.0 /100 | #300 | Tragic 77.6% |
| Nepalese | 0.0 /100 | #301 | Tragic 77.5% |
| Iroquois | 0.0 /100 | #302 | Tragic 77.5% |
| Chippewa | 0.0 /100 | #303 | Tragic 77.3% |
| Immigrants | Mexico | 0.0 /100 | #304 | Tragic 77.3% |
| Mexicans | 0.0 /100 | #305 | Tragic 77.2% |
| Potawatomi | 0.0 /100 | #306 | Tragic 77.2% |
| Central American Indians | 0.0 /100 | #307 | Tragic 77.1% |
| Alaska Natives | 0.0 /100 | #308 | Tragic 77.0% |
| Americans | 0.0 /100 | #309 | Tragic 77.0% |
| Comanche | 0.0 /100 | #310 | Tragic 77.0% |
| Blackfeet | 0.0 /100 | #311 | Tragic 77.0% |
Demographics Similar to Hungarians by In Labor Force | Age 20-64
In terms of in labor force | age 20-64, the demographic groups most similar to Hungarians are Immigrants (79.2%, a difference of 0.010%), Immigrants from Panama (79.1%, a difference of 0.010%), Canadian (79.1%, a difference of 0.010%), Immigrants from Uzbekistan (79.1%, a difference of 0.010%), and French Canadian (79.2%, a difference of 0.030%).
| Demographics | Rating | Rank | In Labor Force | Age 20-64 |
| Immigrants | Armenia | 12.2 /100 | #214 | Poor 79.2% |
| Immigrants | Norway | 12.0 /100 | #215 | Poor 79.2% |
| Arabs | 11.4 /100 | #216 | Poor 79.2% |
| Immigrants | Western Asia | 11.0 /100 | #217 | Poor 79.2% |
| Immigrants | England | 9.3 /100 | #218 | Tragic 79.2% |
| French Canadians | 8.4 /100 | #219 | Tragic 79.2% |
| Immigrants | Immigrants | 7.7 /100 | #220 | Tragic 79.2% |
| Hungarians | 7.2 /100 | #221 | Tragic 79.2% |
| Immigrants | Panama | 6.9 /100 | #222 | Tragic 79.1% |
| Canadians | 6.8 /100 | #223 | Tragic 79.1% |
| Immigrants | Uzbekistan | 6.8 /100 | #224 | Tragic 79.1% |
| Portuguese | 6.4 /100 | #225 | Tragic 79.1% |
| Central Americans | 5.9 /100 | #226 | Tragic 79.1% |
| Immigrants | Western Europe | 5.9 /100 | #227 | Tragic 79.1% |
| Panamanians | 5.7 /100 | #228 | Tragic 79.1% |