Immigrants from Russia vs Hungarian In Labor Force | Age 20-64
COMPARE
Immigrants from Russia
Hungarian
In Labor Force | Age 20-64
In Labor Force | Age 20-64 Comparison
Immigrants from Russia
Hungarians
79.9%
IN LABOR FORCE | AGE 20-64
91.8/ 100
METRIC RATING
123rd/ 347
METRIC RANK
79.2%
IN LABOR FORCE | AGE 20-64
7.2/ 100
METRIC RATING
221st/ 347
METRIC RANK
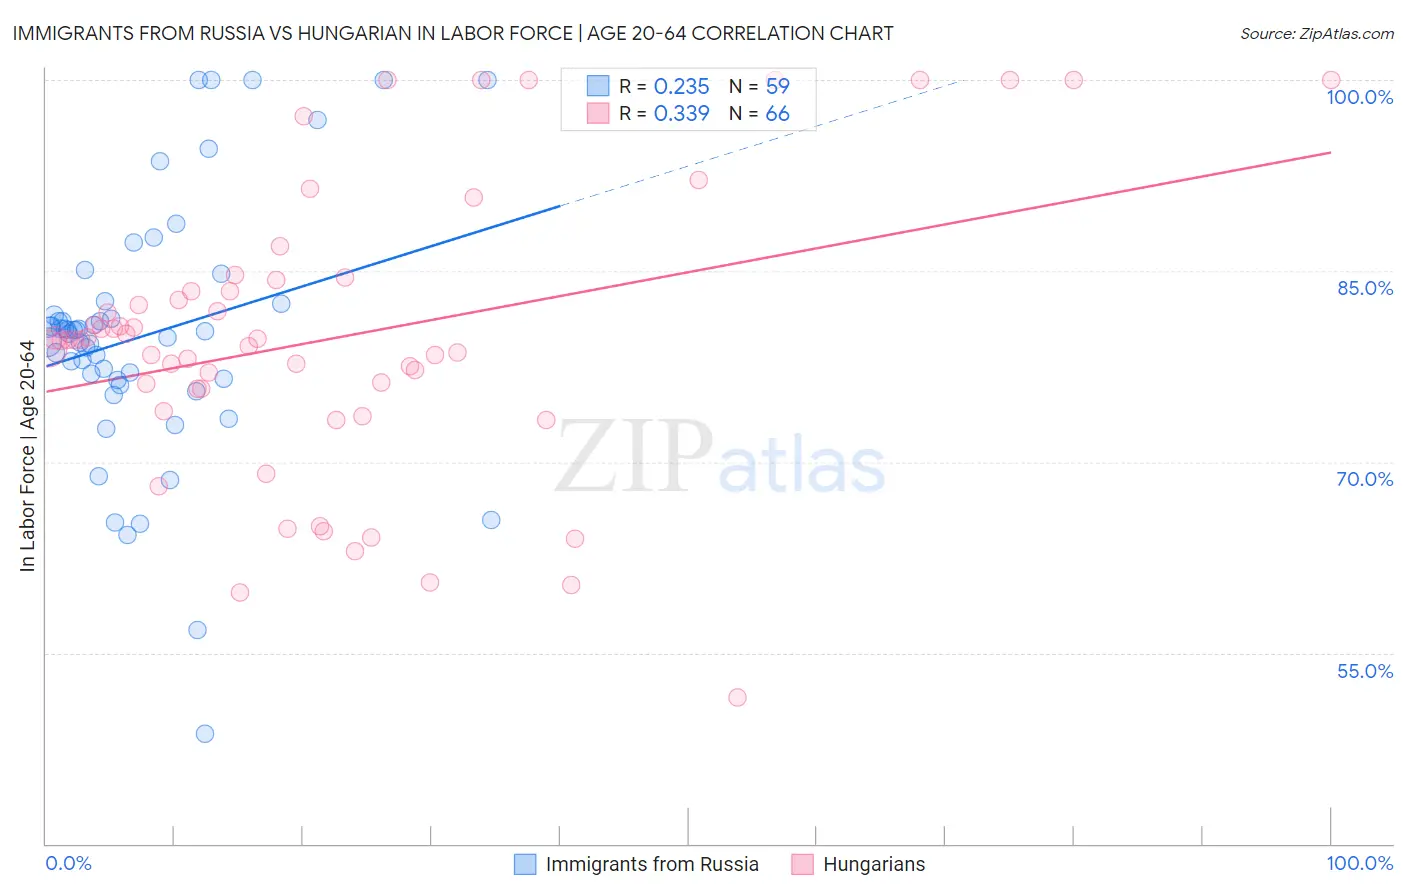
Immigrants from Russia vs Hungarian In Labor Force | Age 20-64 Correlation Chart
The statistical analysis conducted on geographies consisting of 347,958,928 people shows a weak positive correlation between the proportion of Immigrants from Russia and labor force participation rate among population between the ages 20 and 64 in the United States with a correlation coefficient (R) of 0.235 and weighted average of 79.9%. Similarly, the statistical analysis conducted on geographies consisting of 486,244,384 people shows a mild positive correlation between the proportion of Hungarians and labor force participation rate among population between the ages 20 and 64 in the United States with a correlation coefficient (R) of 0.339 and weighted average of 79.2%, a difference of 1.0%.
In Labor Force | Age 20-64 Correlation Summary
| Measurement | Immigrants from Russia | Hungarian |
| Minimum | 48.6% | 51.5% |
| Maximum | 100.0% | 100.0% |
| Range | 51.4% | 48.5% |
| Mean | 79.9% | 79.7% |
| Median | 80.3% | 79.6% |
| Interquartile 25% (IQ1) | 76.4% | 75.8% |
| Interquartile 75% (IQ3) | 82.4% | 83.4% |
| Interquartile Range (IQR) | 6.0% | 7.6% |
| Standard Deviation (Sample) | 10.1% | 11.1% |
| Standard Deviation (Population) | 10.0% | 11.1% |
Similar Demographics by In Labor Force | Age 20-64
Demographics Similar to Immigrants from Russia by In Labor Force | Age 20-64
In terms of in labor force | age 20-64, the demographic groups most similar to Immigrants from Russia are Immigrants from Europe (79.9%, a difference of 0.0%), Immigrants from Kuwait (80.0%, a difference of 0.010%), Mongolian (79.9%, a difference of 0.010%), Danish (79.9%, a difference of 0.010%), and Cape Verdean (80.0%, a difference of 0.020%).
| Demographics | Rating | Rank | In Labor Force | Age 20-64 |
| Immigrants | Western Africa | 93.1 /100 | #116 | Exceptional 80.0% |
| Immigrants | Vietnam | 92.7 /100 | #117 | Exceptional 80.0% |
| Cape Verdeans | 92.7 /100 | #118 | Exceptional 80.0% |
| Immigrants | Taiwan | 92.5 /100 | #119 | Exceptional 80.0% |
| Maltese | 92.4 /100 | #120 | Exceptional 80.0% |
| Immigrants | Kuwait | 92.2 /100 | #121 | Exceptional 80.0% |
| Mongolians | 92.0 /100 | #122 | Exceptional 79.9% |
| Immigrants | Russia | 91.8 /100 | #123 | Exceptional 79.9% |
| Immigrants | Europe | 91.6 /100 | #124 | Exceptional 79.9% |
| Danes | 91.5 /100 | #125 | Exceptional 79.9% |
| Immigrants | France | 90.7 /100 | #126 | Exceptional 79.9% |
| Immigrants | Czechoslovakia | 89.7 /100 | #127 | Excellent 79.9% |
| Immigrants | Eastern Asia | 89.4 /100 | #128 | Excellent 79.9% |
| Italians | 88.9 /100 | #129 | Excellent 79.9% |
| Immigrants | Zaire | 88.6 /100 | #130 | Excellent 79.9% |
Demographics Similar to Hungarians by In Labor Force | Age 20-64
In terms of in labor force | age 20-64, the demographic groups most similar to Hungarians are Immigrants (79.2%, a difference of 0.010%), Immigrants from Panama (79.1%, a difference of 0.010%), Canadian (79.1%, a difference of 0.010%), Immigrants from Uzbekistan (79.1%, a difference of 0.010%), and French Canadian (79.2%, a difference of 0.030%).
| Demographics | Rating | Rank | In Labor Force | Age 20-64 |
| Immigrants | Armenia | 12.2 /100 | #214 | Poor 79.2% |
| Immigrants | Norway | 12.0 /100 | #215 | Poor 79.2% |
| Arabs | 11.4 /100 | #216 | Poor 79.2% |
| Immigrants | Western Asia | 11.0 /100 | #217 | Poor 79.2% |
| Immigrants | England | 9.3 /100 | #218 | Tragic 79.2% |
| French Canadians | 8.4 /100 | #219 | Tragic 79.2% |
| Immigrants | Immigrants | 7.7 /100 | #220 | Tragic 79.2% |
| Hungarians | 7.2 /100 | #221 | Tragic 79.2% |
| Immigrants | Panama | 6.9 /100 | #222 | Tragic 79.1% |
| Canadians | 6.8 /100 | #223 | Tragic 79.1% |
| Immigrants | Uzbekistan | 6.8 /100 | #224 | Tragic 79.1% |
| Portuguese | 6.4 /100 | #225 | Tragic 79.1% |
| Central Americans | 5.9 /100 | #226 | Tragic 79.1% |
| Immigrants | Western Europe | 5.9 /100 | #227 | Tragic 79.1% |
| Panamanians | 5.7 /100 | #228 | Tragic 79.1% |