Immigrants from Sweden vs Hungarian In Labor Force | Age 20-64
COMPARE
Immigrants from Sweden
Hungarian
In Labor Force | Age 20-64
In Labor Force | Age 20-64 Comparison
Immigrants from Sweden
Hungarians
79.8%
IN LABOR FORCE | AGE 20-64
79.7/ 100
METRIC RATING
143rd/ 347
METRIC RANK
79.2%
IN LABOR FORCE | AGE 20-64
7.2/ 100
METRIC RATING
221st/ 347
METRIC RANK
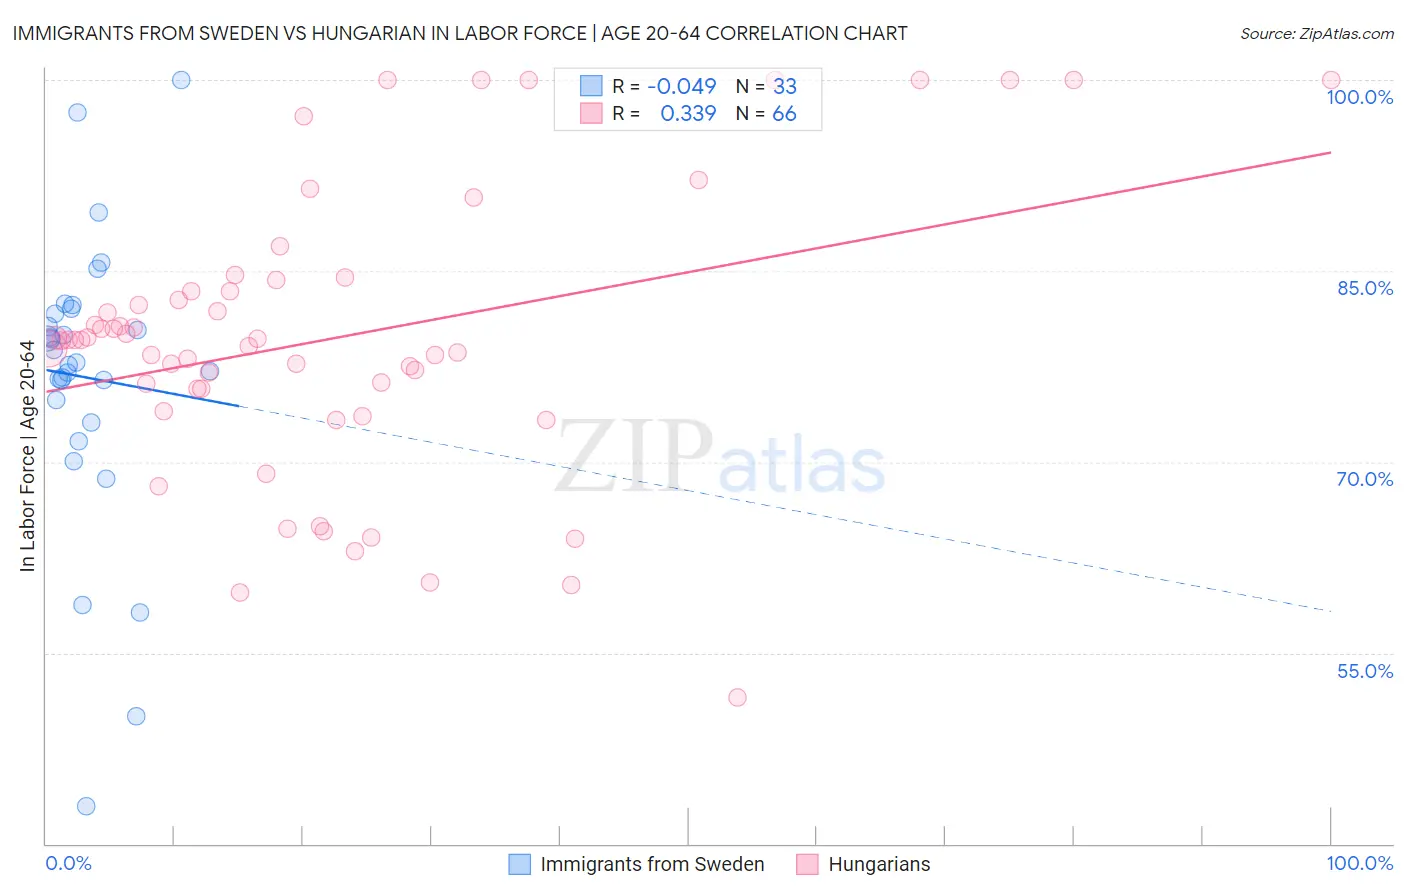
Immigrants from Sweden vs Hungarian In Labor Force | Age 20-64 Correlation Chart
The statistical analysis conducted on geographies consisting of 164,749,668 people shows no correlation between the proportion of Immigrants from Sweden and labor force participation rate among population between the ages 20 and 64 in the United States with a correlation coefficient (R) of -0.049 and weighted average of 79.8%. Similarly, the statistical analysis conducted on geographies consisting of 486,244,384 people shows a mild positive correlation between the proportion of Hungarians and labor force participation rate among population between the ages 20 and 64 in the United States with a correlation coefficient (R) of 0.339 and weighted average of 79.2%, a difference of 0.79%.
In Labor Force | Age 20-64 Correlation Summary
| Measurement | Immigrants from Sweden | Hungarian |
| Minimum | 42.9% | 51.5% |
| Maximum | 100.0% | 100.0% |
| Range | 57.1% | 48.5% |
| Mean | 76.6% | 79.7% |
| Median | 77.8% | 79.6% |
| Interquartile 25% (IQ1) | 74.0% | 75.8% |
| Interquartile 75% (IQ3) | 81.8% | 83.4% |
| Interquartile Range (IQR) | 7.8% | 7.6% |
| Standard Deviation (Sample) | 11.4% | 11.1% |
| Standard Deviation (Population) | 11.2% | 11.1% |
Similar Demographics by In Labor Force | Age 20-64
Demographics Similar to Immigrants from Sweden by In Labor Force | Age 20-64
In terms of in labor force | age 20-64, the demographic groups most similar to Immigrants from Sweden are Immigrants from Israel (79.8%, a difference of 0.0%), Slovak (79.8%, a difference of 0.0%), Korean (79.8%, a difference of 0.0%), Immigrants from South Eastern Asia (79.8%, a difference of 0.010%), and Pakistani (79.8%, a difference of 0.010%).
| Demographics | Rating | Rank | In Labor Force | Age 20-64 |
| Immigrants | Singapore | 86.7 /100 | #136 | Excellent 79.9% |
| Immigrants | Ukraine | 86.5 /100 | #137 | Excellent 79.9% |
| Immigrants | Nigeria | 86.4 /100 | #138 | Excellent 79.9% |
| Immigrants | Spain | 83.9 /100 | #139 | Excellent 79.8% |
| Immigrants | South Eastern Asia | 80.4 /100 | #140 | Excellent 79.8% |
| Immigrants | Israel | 80.0 /100 | #141 | Good 79.8% |
| Slovaks | 79.9 /100 | #142 | Good 79.8% |
| Immigrants | Sweden | 79.7 /100 | #143 | Good 79.8% |
| Koreans | 79.6 /100 | #144 | Good 79.8% |
| Pakistanis | 79.3 /100 | #145 | Good 79.8% |
| Immigrants | Southern Europe | 78.9 /100 | #146 | Good 79.8% |
| Immigrants | Philippines | 78.0 /100 | #147 | Good 79.8% |
| Romanians | 77.6 /100 | #148 | Good 79.8% |
| Icelanders | 75.1 /100 | #149 | Good 79.7% |
| Costa Ricans | 72.4 /100 | #150 | Good 79.7% |
Demographics Similar to Hungarians by In Labor Force | Age 20-64
In terms of in labor force | age 20-64, the demographic groups most similar to Hungarians are Immigrants (79.2%, a difference of 0.010%), Immigrants from Panama (79.1%, a difference of 0.010%), Canadian (79.1%, a difference of 0.010%), Immigrants from Uzbekistan (79.1%, a difference of 0.010%), and French Canadian (79.2%, a difference of 0.030%).
| Demographics | Rating | Rank | In Labor Force | Age 20-64 |
| Immigrants | Armenia | 12.2 /100 | #214 | Poor 79.2% |
| Immigrants | Norway | 12.0 /100 | #215 | Poor 79.2% |
| Arabs | 11.4 /100 | #216 | Poor 79.2% |
| Immigrants | Western Asia | 11.0 /100 | #217 | Poor 79.2% |
| Immigrants | England | 9.3 /100 | #218 | Tragic 79.2% |
| French Canadians | 8.4 /100 | #219 | Tragic 79.2% |
| Immigrants | Immigrants | 7.7 /100 | #220 | Tragic 79.2% |
| Hungarians | 7.2 /100 | #221 | Tragic 79.2% |
| Immigrants | Panama | 6.9 /100 | #222 | Tragic 79.1% |
| Canadians | 6.8 /100 | #223 | Tragic 79.1% |
| Immigrants | Uzbekistan | 6.8 /100 | #224 | Tragic 79.1% |
| Portuguese | 6.4 /100 | #225 | Tragic 79.1% |
| Central Americans | 5.9 /100 | #226 | Tragic 79.1% |
| Immigrants | Western Europe | 5.9 /100 | #227 | Tragic 79.1% |
| Panamanians | 5.7 /100 | #228 | Tragic 79.1% |