Belgian vs Hungarian In Labor Force | Age 20-64
COMPARE
Belgian
Hungarian
In Labor Force | Age 20-64
In Labor Force | Age 20-64 Comparison
Belgians
Hungarians
79.9%
IN LABOR FORCE | AGE 20-64
87.4/ 100
METRIC RATING
134th/ 347
METRIC RANK
79.2%
IN LABOR FORCE | AGE 20-64
7.2/ 100
METRIC RATING
221st/ 347
METRIC RANK
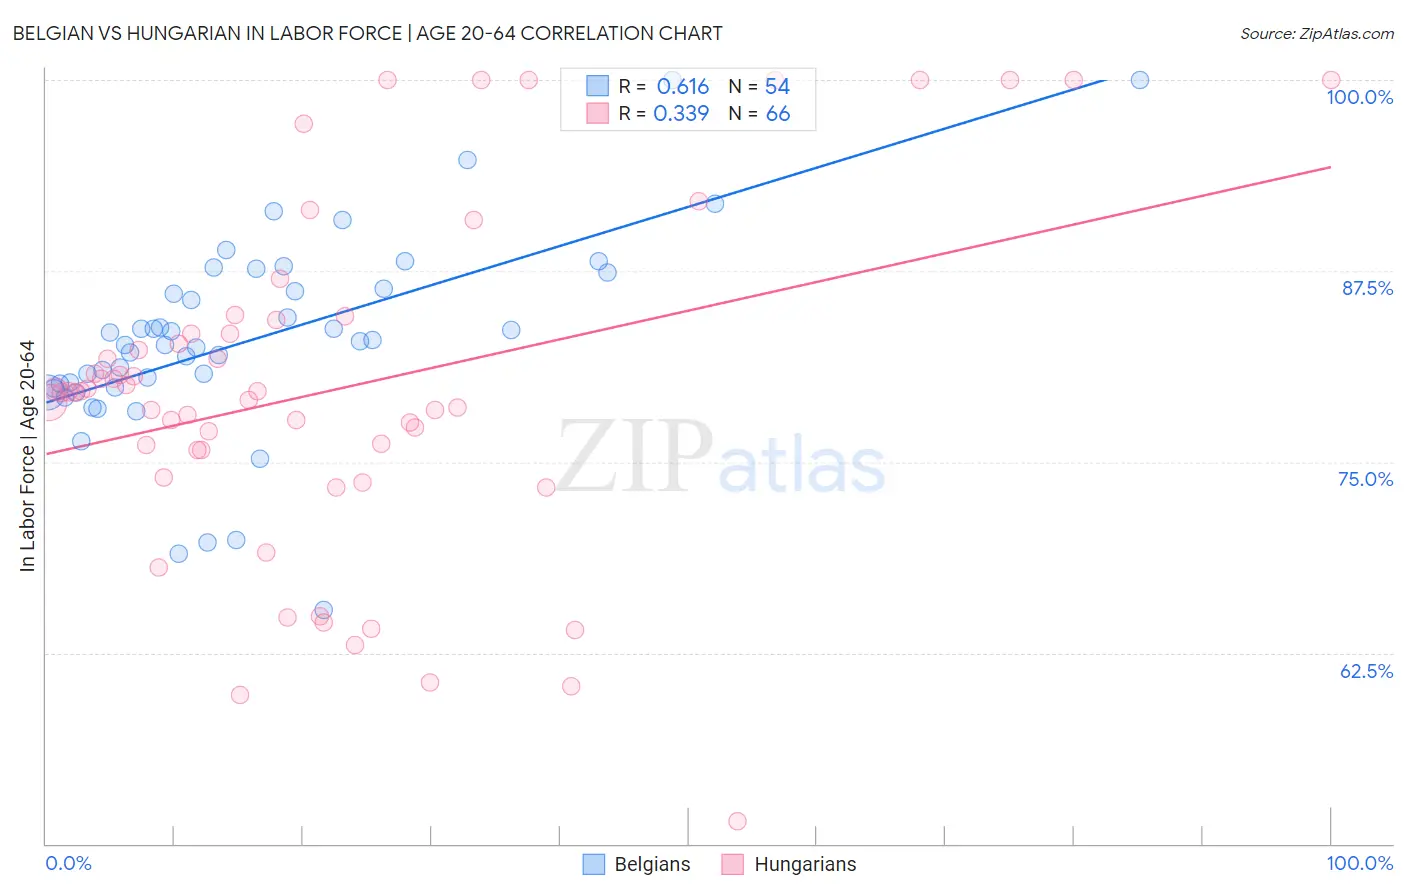
Belgian vs Hungarian In Labor Force | Age 20-64 Correlation Chart
The statistical analysis conducted on geographies consisting of 356,033,088 people shows a significant positive correlation between the proportion of Belgians and labor force participation rate among population between the ages 20 and 64 in the United States with a correlation coefficient (R) of 0.616 and weighted average of 79.9%. Similarly, the statistical analysis conducted on geographies consisting of 486,244,384 people shows a mild positive correlation between the proportion of Hungarians and labor force participation rate among population between the ages 20 and 64 in the United States with a correlation coefficient (R) of 0.339 and weighted average of 79.2%, a difference of 0.91%.
In Labor Force | Age 20-64 Correlation Summary
| Measurement | Belgian | Hungarian |
| Minimum | 65.3% | 51.5% |
| Maximum | 100.0% | 100.0% |
| Range | 34.7% | 48.5% |
| Mean | 83.0% | 79.7% |
| Median | 82.8% | 79.6% |
| Interquartile 25% (IQ1) | 79.9% | 75.8% |
| Interquartile 75% (IQ3) | 86.3% | 83.4% |
| Interquartile Range (IQR) | 6.4% | 7.6% |
| Standard Deviation (Sample) | 6.5% | 11.1% |
| Standard Deviation (Population) | 6.5% | 11.1% |
Similar Demographics by In Labor Force | Age 20-64
Demographics Similar to Belgians by In Labor Force | Age 20-64
In terms of in labor force | age 20-64, the demographic groups most similar to Belgians are Indian (Asian) (79.9%, a difference of 0.0%), South American Indian (79.9%, a difference of 0.0%), Ukrainian (79.9%, a difference of 0.010%), Immigrants from Singapore (79.9%, a difference of 0.010%), and Immigrants from Zaire (79.9%, a difference of 0.020%).
| Demographics | Rating | Rank | In Labor Force | Age 20-64 |
| Immigrants | Czechoslovakia | 89.7 /100 | #127 | Excellent 79.9% |
| Immigrants | Eastern Asia | 89.4 /100 | #128 | Excellent 79.9% |
| Italians | 88.9 /100 | #129 | Excellent 79.9% |
| Immigrants | Zaire | 88.6 /100 | #130 | Excellent 79.9% |
| Immigrants | Iran | 88.3 /100 | #131 | Excellent 79.9% |
| Indians (Asian) | 87.7 /100 | #132 | Excellent 79.9% |
| South American Indians | 87.6 /100 | #133 | Excellent 79.9% |
| Belgians | 87.4 /100 | #134 | Excellent 79.9% |
| Ukrainians | 86.8 /100 | #135 | Excellent 79.9% |
| Immigrants | Singapore | 86.7 /100 | #136 | Excellent 79.9% |
| Immigrants | Ukraine | 86.5 /100 | #137 | Excellent 79.9% |
| Immigrants | Nigeria | 86.4 /100 | #138 | Excellent 79.9% |
| Immigrants | Spain | 83.9 /100 | #139 | Excellent 79.8% |
| Immigrants | South Eastern Asia | 80.4 /100 | #140 | Excellent 79.8% |
| Immigrants | Israel | 80.0 /100 | #141 | Good 79.8% |
Demographics Similar to Hungarians by In Labor Force | Age 20-64
In terms of in labor force | age 20-64, the demographic groups most similar to Hungarians are Immigrants (79.2%, a difference of 0.010%), Immigrants from Panama (79.1%, a difference of 0.010%), Canadian (79.1%, a difference of 0.010%), Immigrants from Uzbekistan (79.1%, a difference of 0.010%), and French Canadian (79.2%, a difference of 0.030%).
| Demographics | Rating | Rank | In Labor Force | Age 20-64 |
| Immigrants | Armenia | 12.2 /100 | #214 | Poor 79.2% |
| Immigrants | Norway | 12.0 /100 | #215 | Poor 79.2% |
| Arabs | 11.4 /100 | #216 | Poor 79.2% |
| Immigrants | Western Asia | 11.0 /100 | #217 | Poor 79.2% |
| Immigrants | England | 9.3 /100 | #218 | Tragic 79.2% |
| French Canadians | 8.4 /100 | #219 | Tragic 79.2% |
| Immigrants | Immigrants | 7.7 /100 | #220 | Tragic 79.2% |
| Hungarians | 7.2 /100 | #221 | Tragic 79.2% |
| Immigrants | Panama | 6.9 /100 | #222 | Tragic 79.1% |
| Canadians | 6.8 /100 | #223 | Tragic 79.1% |
| Immigrants | Uzbekistan | 6.8 /100 | #224 | Tragic 79.1% |
| Portuguese | 6.4 /100 | #225 | Tragic 79.1% |
| Central Americans | 5.9 /100 | #226 | Tragic 79.1% |
| Immigrants | Western Europe | 5.9 /100 | #227 | Tragic 79.1% |
| Panamanians | 5.7 /100 | #228 | Tragic 79.1% |