Immigrants from Bahamas vs Colville In Labor Force | Age > 16
COMPARE
Immigrants from Bahamas
Colville
In Labor Force | Age > 16
In Labor Force | Age > 16 Comparison
Immigrants from Bahamas
Colville
64.0%
IN LABOR FORCE | AGE > 16
0.3/ 100
METRIC RATING
277th/ 347
METRIC RANK
59.8%
IN LABOR FORCE | AGE > 16
0.0/ 100
METRIC RATING
337th/ 347
METRIC RANK
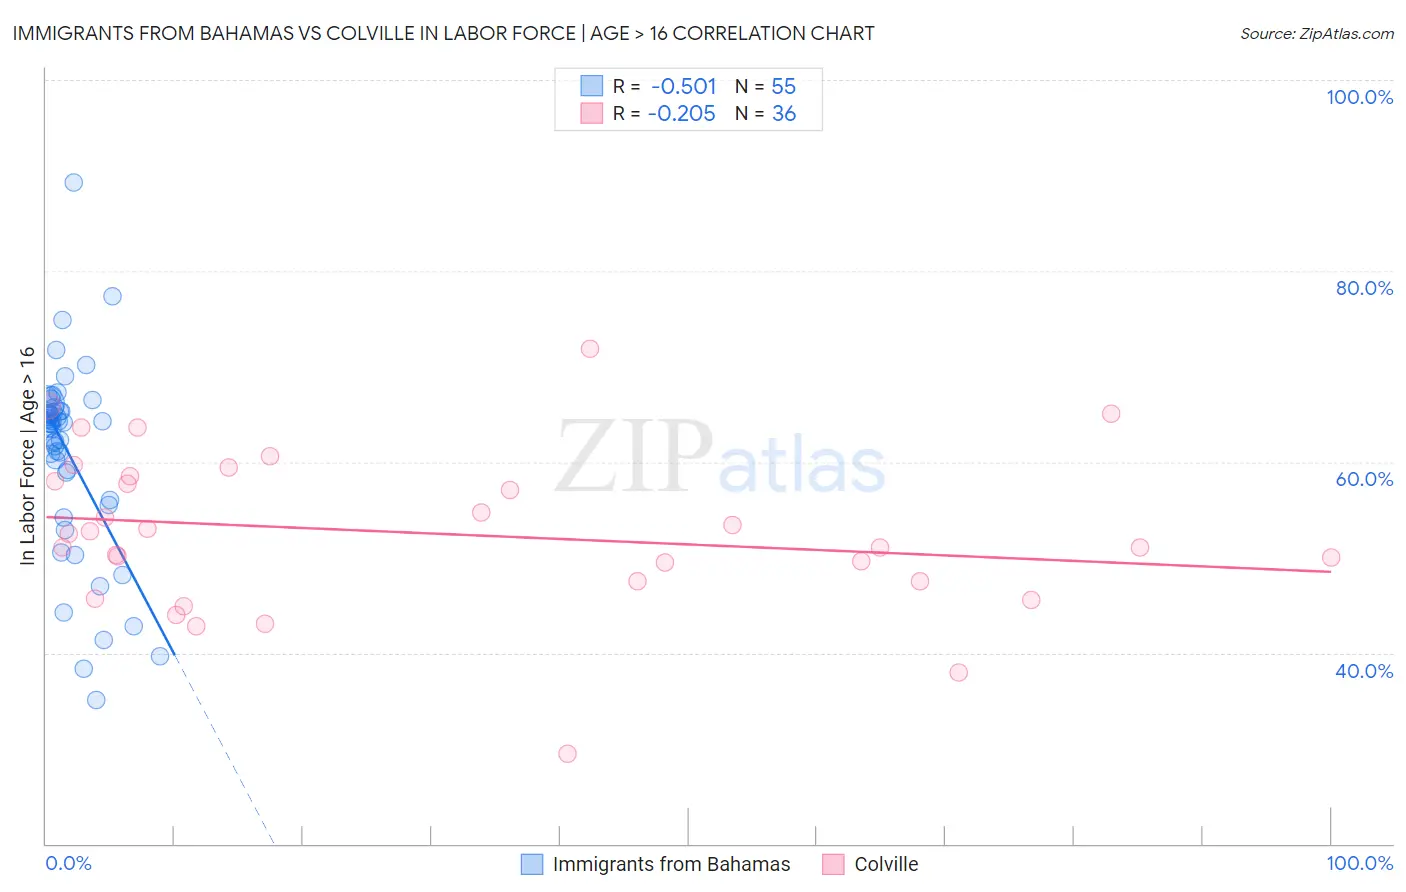
Immigrants from Bahamas vs Colville In Labor Force | Age > 16 Correlation Chart
The statistical analysis conducted on geographies consisting of 104,666,072 people shows a substantial negative correlation between the proportion of Immigrants from Bahamas and labor force participation rate among population ages 16 and over in the United States with a correlation coefficient (R) of -0.501 and weighted average of 64.0%. Similarly, the statistical analysis conducted on geographies consisting of 34,687,961 people shows a weak negative correlation between the proportion of Colville and labor force participation rate among population ages 16 and over in the United States with a correlation coefficient (R) of -0.205 and weighted average of 59.8%, a difference of 7.1%.
In Labor Force | Age > 16 Correlation Summary
| Measurement | Immigrants from Bahamas | Colville |
| Minimum | 35.0% | 29.4% |
| Maximum | 89.3% | 71.9% |
| Range | 54.3% | 42.5% |
| Mean | 60.8% | 52.5% |
| Median | 64.0% | 51.7% |
| Interquartile 25% (IQ1) | 56.0% | 47.5% |
| Interquartile 75% (IQ3) | 65.3% | 58.2% |
| Interquartile Range (IQR) | 9.3% | 10.7% |
| Standard Deviation (Sample) | 10.0% | 8.4% |
| Standard Deviation (Population) | 9.9% | 8.3% |
Similar Demographics by In Labor Force | Age > 16
Demographics Similar to Immigrants from Bahamas by In Labor Force | Age > 16
In terms of in labor force | age > 16, the demographic groups most similar to Immigrants from Bahamas are Assyrian/Chaldean/Syriac (64.0%, a difference of 0.020%), Immigrants from Cuba (64.1%, a difference of 0.030%), Mexican (64.1%, a difference of 0.030%), French American Indian (64.1%, a difference of 0.030%), and Native Hawaiian (64.1%, a difference of 0.050%).
| Demographics | Rating | Rank | In Labor Force | Age > 16 |
| Guyanese | 0.4 /100 | #270 | Tragic 64.1% |
| Dominicans | 0.4 /100 | #271 | Tragic 64.1% |
| Native Hawaiians | 0.3 /100 | #272 | Tragic 64.1% |
| Hmong | 0.3 /100 | #273 | Tragic 64.1% |
| Immigrants | Cuba | 0.3 /100 | #274 | Tragic 64.1% |
| Mexicans | 0.3 /100 | #275 | Tragic 64.1% |
| French American Indians | 0.3 /100 | #276 | Tragic 64.1% |
| Immigrants | Bahamas | 0.3 /100 | #277 | Tragic 64.0% |
| Assyrians/Chaldeans/Syriacs | 0.3 /100 | #278 | Tragic 64.0% |
| Welsh | 0.2 /100 | #279 | Tragic 64.0% |
| Immigrants | St. Vincent and the Grenadines | 0.2 /100 | #280 | Tragic 64.0% |
| French Canadians | 0.2 /100 | #281 | Tragic 64.0% |
| Immigrants | Guyana | 0.2 /100 | #282 | Tragic 64.0% |
| Immigrants | Germany | 0.1 /100 | #283 | Tragic 63.9% |
| French | 0.1 /100 | #284 | Tragic 63.9% |
Demographics Similar to Colville by In Labor Force | Age > 16
In terms of in labor force | age > 16, the demographic groups most similar to Colville are Immigrants from Yemen (59.6%, a difference of 0.27%), Houma (59.5%, a difference of 0.52%), Pueblo (59.3%, a difference of 0.92%), Menominee (60.6%, a difference of 1.3%), and Native/Alaskan (60.6%, a difference of 1.3%).
| Demographics | Rating | Rank | In Labor Force | Age > 16 |
| Creek | 0.0 /100 | #330 | Tragic 61.3% |
| Ute | 0.0 /100 | #331 | Tragic 60.9% |
| Crow | 0.0 /100 | #332 | Tragic 60.8% |
| Paiute | 0.0 /100 | #333 | Tragic 60.7% |
| Apache | 0.0 /100 | #334 | Tragic 60.7% |
| Natives/Alaskans | 0.0 /100 | #335 | Tragic 60.6% |
| Menominee | 0.0 /100 | #336 | Tragic 60.6% |
| Colville | 0.0 /100 | #337 | Tragic 59.8% |
| Immigrants | Yemen | 0.0 /100 | #338 | Tragic 59.6% |
| Houma | 0.0 /100 | #339 | Tragic 59.5% |
| Pueblo | 0.0 /100 | #340 | Tragic 59.3% |
| Hopi | 0.0 /100 | #341 | Tragic 58.4% |
| Puerto Ricans | 0.0 /100 | #342 | Tragic 58.1% |
| Yuman | 0.0 /100 | #343 | Tragic 57.8% |
| Pima | 0.0 /100 | #344 | Tragic 57.4% |