Immigrants from Bahamas vs Immigrants from Canada In Labor Force | Age > 16

COMPARE

Immigrants from Bahamas
Race
Ancestry
AfghanAfricanAlaska NativeAlaskan AthabascanAlbanianAleutAlsatianAmericanApacheArabArapahoArgentineanArmenianAssyrian/Chaldean/SyriacAustralianAustrianBahamianBangladeshiBarbadianBasqueBelgianBelizeanBermudanBhutaneseBlackfeetBolivianBrazilianBritishBritish West IndianBulgarianBurmeseCajunCambodianCanadianCape VerdeanCarpatho RusynCelticCentral AmericanCentral American IndianCherokeeCheyenneChickasawChileanChineseChippewaChoctawColombianColvilleComancheCosta RicanCreeCreekCroatianCrowCubanCypriotCzechCzechoslovakianDanishDelawareDominicanDutchDutch West IndianEastern EuropeanEcuadorianEgyptianEnglishEstonianEthiopianEuropeanFijianFilipinoFinnishFrenchFrench American IndianFrench CanadianGermanGerman RussianGhanaianGreekGuamanian/ChamorroGuatemalanGuyaneseHaitianHmongHonduranHopiHoumaHungarianIcelanderIndian (Asian)IndonesianInupiatIranianIraqiIrishIroquoisIsraeliItalianJamaicanJapaneseJordanianKenyanKiowaKoreanLaotianLatvianLebaneseLiberianLithuanianLumbeeLuxembourgerMacedonianMalaysianMalteseMarshalleseMenomineeMexicanMexican American IndianMongolianMoroccanNative HawaiianNavajoNepaleseNew ZealanderNicaraguanNigerianNorthern EuropeanNorwegianOkinawanOsageOttawaPaiutePakistaniPalestinianPanamanianParaguayanPennsylvania GermanPeruvianPimaPolishPortuguesePotawatomiPuebloPuerto RicanPuget Sound SalishRomanianRussianSalvadoranSamoanScandinavianScotch-IrishScottishSeminoleSenegaleseSerbianShoshoneSierra LeoneanSiouxSlavicSlovakSloveneSomaliSouth AfricanSouth AmericanSouth American IndianSoviet UnionSpaniardSpanishSpanish AmericanSpanish American IndianSri LankanSubsaharan AfricanSudaneseSwedishSwissSyrianTaiwaneseThaiTlingit-HaidaTohono O'OdhamTonganTrinidadian and TobagonianTsimshianTurkishU.S. Virgin IslanderUgandanUkrainianUruguayanUteVenezuelanVietnameseWelshWest IndianYakamaYaquiYugoslavianYumanYup'ikZimbabwean
Immigration
NonimmigrantsImmigrantsAfghanistanAfricaAlbaniaArgentinaArmeniaAsiaAustraliaAustriaBahamasBangladeshBarbadosBelarusBelgiumBelizeBoliviaBosnia and HerzegovinaBrazilBulgariaBurma/MyanmarCabo VerdeCambodiaCameroonCaribbeanCentral AmericaChileChinaColombiaCongoCosta RicaCroatiaCubaCzechoslovakiaDenmarkDominicaDominican RepublicEastern AfricaEastern AsiaEastern EuropeEcuadorEgyptEl SalvadorEnglandEritreaEthiopiaEuropeFijiFranceGermanyGhanaGreeceGrenadaGuatemalaGuyanaHaitiHondurasHong KongHungaryIndiaIndonesiaIranIraqIrelandIsraelItalyJamaicaJapanJordanKazakhstanKenyaKoreaKuwaitLaosLatin AmericaLatviaLebanonLiberiaLithuaniaMalaysiaMexicoMicronesiaMiddle AfricaMoldovaMoroccoNepalNetherlandsNicaraguaNigeriaNorth AmericaNorth MacedoniaNorthern AfricaNorthern EuropeNorwayOceaniaPakistanPanamaPeruPhilippinesPolandPortugalRomaniaRussiaSaudi ArabiaScotlandSenegalSerbiaSierra LeoneSingaporeSomaliaSouth AfricaSouth AmericaSouth Central AsiaSouth Eastern AsiaSouthern EuropeSpainSri LankaSt. Vincent and the GrenadinesSudanSwedenSwitzerlandSyriaTaiwanThailandTrinidad and TobagoTurkeyUgandaUkraineUruguayUzbekistanVenezuelaVietnamWest IndiesWestern AfricaWestern AsiaWestern EuropeYemenZaireZimbabweAzores
Immigrants from Canada
Race
Ancestry
AfghanAfricanAlaska NativeAlaskan AthabascanAlbanianAleutAlsatianAmericanApacheArabArapahoArgentineanArmenianAssyrian/Chaldean/SyriacAustralianAustrianBahamianBangladeshiBarbadianBasqueBelgianBelizeanBermudanBhutaneseBlackfeetBolivianBrazilianBritishBritish West IndianBulgarianBurmeseCajunCambodianCanadianCape VerdeanCarpatho RusynCelticCentral AmericanCentral American IndianCherokeeCheyenneChickasawChileanChineseChippewaChoctawColombianColvilleComancheCosta RicanCreeCreekCroatianCrowCubanCypriotCzechCzechoslovakianDanishDelawareDominicanDutchDutch West IndianEastern EuropeanEcuadorianEgyptianEnglishEstonianEthiopianEuropeanFijianFilipinoFinnishFrenchFrench American IndianFrench CanadianGermanGerman RussianGhanaianGreekGuamanian/ChamorroGuatemalanGuyaneseHaitianHmongHonduranHopiHoumaHungarianIcelanderIndian (Asian)IndonesianInupiatIranianIraqiIrishIroquoisIsraeliItalianJamaicanJapaneseJordanianKenyanKiowaKoreanLaotianLatvianLebaneseLiberianLithuanianLumbeeLuxembourgerMacedonianMalaysianMalteseMarshalleseMenomineeMexicanMexican American IndianMongolianMoroccanNative HawaiianNavajoNepaleseNew ZealanderNicaraguanNigerianNorthern EuropeanNorwegianOkinawanOsageOttawaPaiutePakistaniPalestinianPanamanianParaguayanPennsylvania GermanPeruvianPimaPolishPortuguesePotawatomiPuebloPuerto RicanPuget Sound SalishRomanianRussianSalvadoranSamoanScandinavianScotch-IrishScottishSeminoleSenegaleseSerbianShoshoneSierra LeoneanSiouxSlavicSlovakSloveneSomaliSouth AfricanSouth AmericanSouth American IndianSoviet UnionSpaniardSpanishSpanish AmericanSpanish American IndianSri LankanSubsaharan AfricanSudaneseSwedishSwissSyrianTaiwaneseThaiTlingit-HaidaTohono O'OdhamTonganTrinidadian and TobagonianTsimshianTurkishU.S. Virgin IslanderUgandanUkrainianUruguayanUteVenezuelanVietnameseWelshWest IndianYakamaYaquiYugoslavianYumanYup'ikZimbabwean
Immigration
NonimmigrantsImmigrantsAfghanistanAfricaAlbaniaArgentinaArmeniaAsiaAustraliaAustriaBangladeshBarbadosBelarusBelgiumBelizeBoliviaBosnia and HerzegovinaBrazilBulgariaBurma/MyanmarCabo VerdeCambodiaCameroonCanadaCaribbeanCentral AmericaChileChinaColombiaCongoCosta RicaCroatiaCubaCzechoslovakiaDenmarkDominicaDominican RepublicEastern AfricaEastern AsiaEastern EuropeEcuadorEgyptEl SalvadorEnglandEritreaEthiopiaEuropeFijiFranceGermanyGhanaGreeceGrenadaGuatemalaGuyanaHaitiHondurasHong KongHungaryIndiaIndonesiaIranIraqIrelandIsraelItalyJamaicaJapanJordanKazakhstanKenyaKoreaKuwaitLaosLatin AmericaLatviaLebanonLiberiaLithuaniaMalaysiaMexicoMicronesiaMiddle AfricaMoldovaMoroccoNepalNetherlandsNicaraguaNigeriaNorth AmericaNorth MacedoniaNorthern AfricaNorthern EuropeNorwayOceaniaPakistanPanamaPeruPhilippinesPolandPortugalRomaniaRussiaSaudi ArabiaScotlandSenegalSerbiaSierra LeoneSingaporeSomaliaSouth AfricaSouth AmericaSouth Central AsiaSouth Eastern AsiaSouthern EuropeSpainSri LankaSt. Vincent and the GrenadinesSudanSwedenSwitzerlandSyriaTaiwanThailandTrinidad and TobagoTurkeyUgandaUkraineUruguayUzbekistanVenezuelaVietnamWest IndiesWestern AfricaWestern AsiaWestern EuropeYemenZaireZimbabweAzores
In Labor Force | Age > 16
Income
Poverty
Unemployment
Labor Participation
Family Structure
Vehicle Availability
Education Level
Disability

In Labor Force | Age > 16 Comparison

Immigrants from Bahamas

Immigrants from Canada

Tragic
Tragic
64.0%
IN LABOR FORCE | AGE > 16
0.3/ 100
METRIC RATING
277th/ 347
METRIC RANK
63.7%
IN LABOR FORCE | AGE > 16
0.0/ 100
METRIC RATING
295th/ 347
METRIC RANK

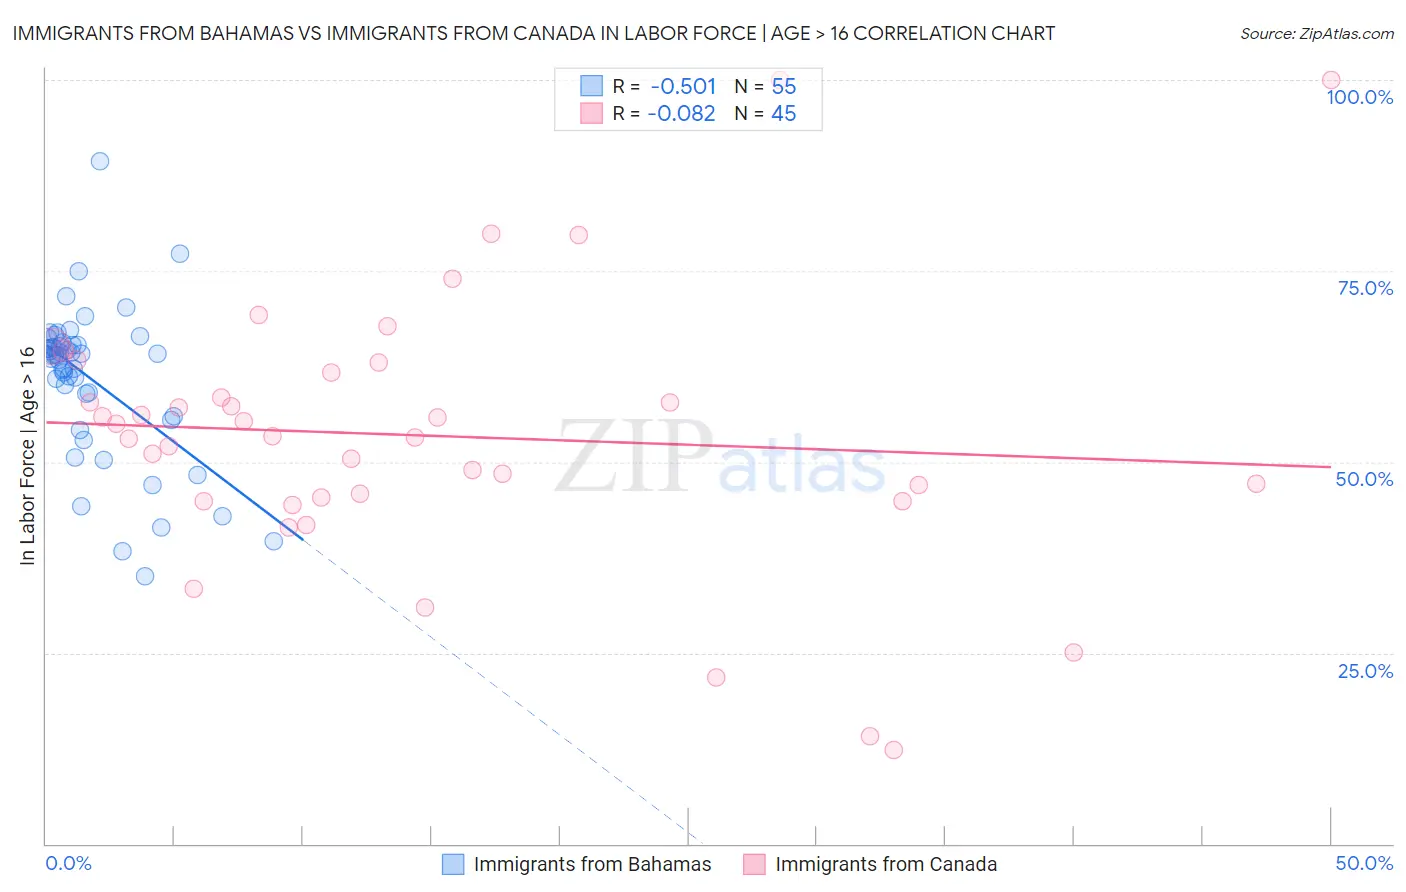
Immigrants from Bahamas vs Immigrants from Canada In Labor Force | Age > 16 Correlation Chart

The statistical analysis conducted on geographies consisting of 104,666,072 people shows a substantial negative correlation between the proportion of Immigrants from Bahamas and labor force participation rate among population ages 16 and over in the United States with a correlation coefficient (R) of -0.501 and weighted average of 64.0%. Similarly, the statistical analysis conducted on geographies consisting of 459,409,569 people shows a slight negative correlation between the proportion of Immigrants from Canada and labor force participation rate among population ages 16 and over in the United States with a correlation coefficient (R) of -0.082 and weighted average of 63.7%, a difference of 0.56%.
Immigrants from Bahamas vs Immigrants from Canada In Labor Force | Age > 16

In Labor Force | Age > 16 Correlation Summary

MeasurementImmigrants from BahamasImmigrants from Canada
Minimum35.0%12.2%
Maximum89.3%100.0%
Range54.3%87.8%
Mean60.8%53.4%
Median64.0%53.3%
Interquartile 25% (IQ1)56.0%45.2%
Interquartile 75% (IQ3)65.3%62.4%
Interquartile Range (IQR)9.3%17.2%
Standard Deviation (Sample)10.0%17.8%
Standard Deviation (Population)9.9%17.6%

Demographics Similar to Immigrants from Bahamas and Immigrants from Canada by In Labor Force | Age > 16

In terms of in labor force | age > 16, the demographic groups most similar to Immigrants from Bahamas are Assyrian/Chaldean/Syriac (64.0%, a difference of 0.020%), French American Indian (64.1%, a difference of 0.030%), Welsh (64.0%, a difference of 0.060%), Immigrants from St. Vincent and the Grenadines (64.0%, a difference of 0.060%), and French Canadian (64.0%, a difference of 0.070%). Similarly, the demographic groups most similar to Immigrants from Canada are Immigrants from North America (63.7%, a difference of 0.020%), Puget Sound Salish (63.7%, a difference of 0.050%), English (63.7%, a difference of 0.080%), Spanish American Indian (63.8%, a difference of 0.12%), and Nepalese (63.8%, a difference of 0.18%).
DemographicsRating | RankIn Labor Force | Age > 16
French American Indians
0.3
/100
|
#276
Tragic
64.1%
Immigrants | Bahamas
0.3
/100
|
#277
Tragic
64.0%
Assyrians/Chaldeans/Syriacs
0.3
/100
|
#278
Tragic
64.0%
Welsh
0.2
/100
|
#279
Tragic
64.0%
Immigrants | St. Vincent and the Grenadines
0.2
/100
|
#280
Tragic
64.0%
French Canadians
0.2
/100
|
#281
Tragic
64.0%
Immigrants | Guyana
0.2
/100
|
#282
Tragic
64.0%
Immigrants | Germany
0.1
/100
|
#283
Tragic
63.9%
French
0.1
/100
|
#284
Tragic
63.9%
Slovaks
0.1
/100
|
#285
Tragic
63.9%
Immigrants | Austria
0.1
/100
|
#286
Tragic
63.9%
Scottish
0.1
/100
|
#287
Tragic
63.9%
Spanish
0.1
/100
|
#288
Tragic
63.9%
Celtics
0.1
/100
|
#289
Tragic
63.8%
Hungarians
0.1
/100
|
#290
Tragic
63.8%
Nepalese
0.1
/100
|
#291
Tragic
63.8%
Spanish American Indians
0.1
/100
|
#292
Tragic
63.8%
English
0.1
/100
|
#293
Tragic
63.7%
Puget Sound Salish
0.0
/100
|
#294
Tragic
63.7%
Immigrants | Canada
0.0
/100
|
#295
Tragic
63.7%
Immigrants | North America
0.0
/100
|
#296
Tragic
63.7%