Immigrants from Bahamas vs Maltese In Labor Force | Age > 16
COMPARE
Immigrants from Bahamas
Maltese
In Labor Force | Age > 16
In Labor Force | Age > 16 Comparison
Immigrants from Bahamas
Maltese
64.0%
IN LABOR FORCE | AGE > 16
0.3/ 100
METRIC RATING
277th/ 347
METRIC RANK
64.8%
IN LABOR FORCE | AGE > 16
13.8/ 100
METRIC RATING
213th/ 347
METRIC RANK
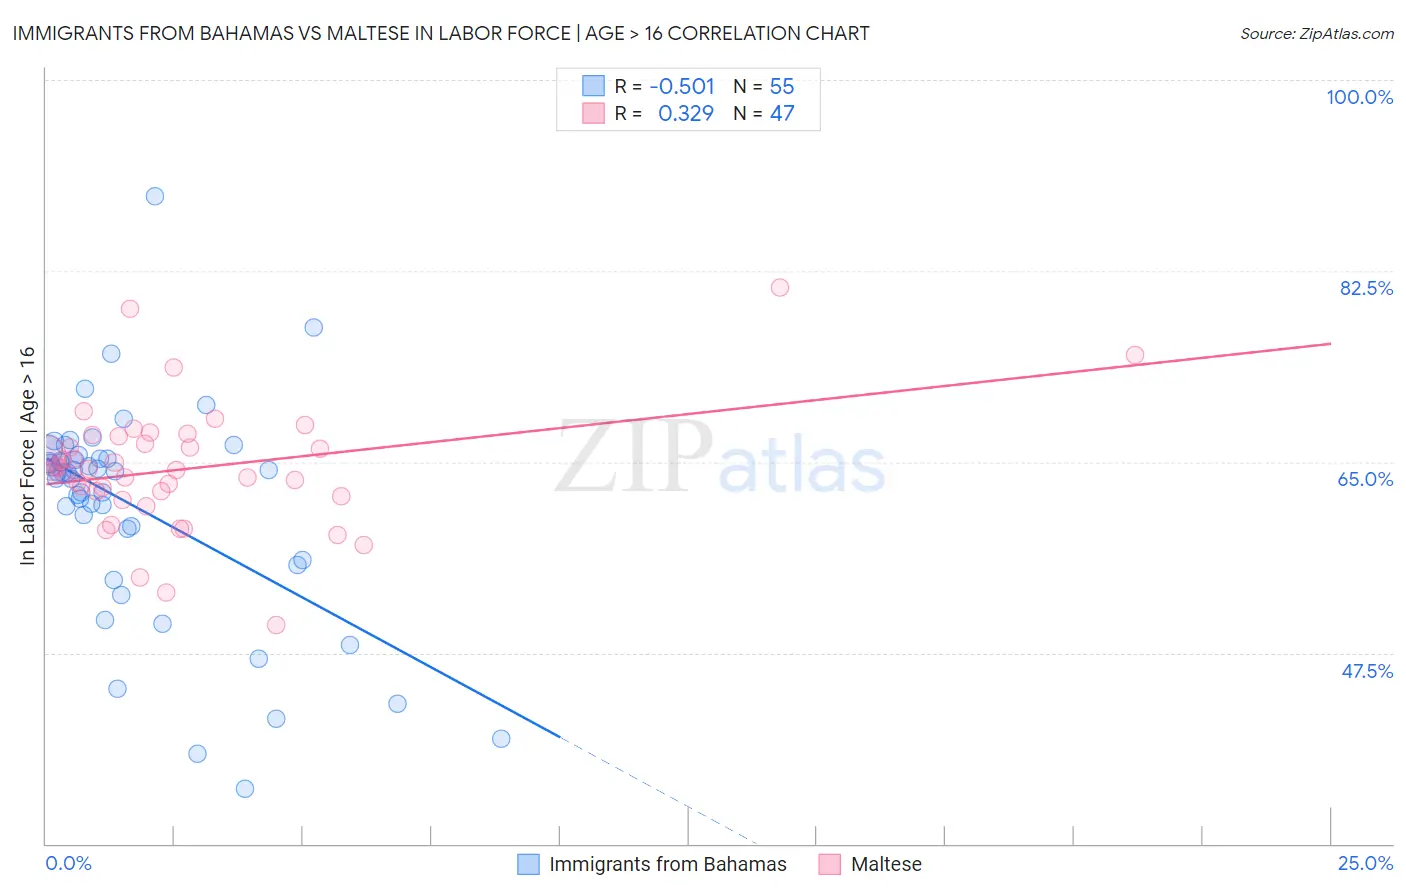
Immigrants from Bahamas vs Maltese In Labor Force | Age > 16 Correlation Chart
The statistical analysis conducted on geographies consisting of 104,666,072 people shows a substantial negative correlation between the proportion of Immigrants from Bahamas and labor force participation rate among population ages 16 and over in the United States with a correlation coefficient (R) of -0.501 and weighted average of 64.0%. Similarly, the statistical analysis conducted on geographies consisting of 126,477,906 people shows a mild positive correlation between the proportion of Maltese and labor force participation rate among population ages 16 and over in the United States with a correlation coefficient (R) of 0.329 and weighted average of 64.8%, a difference of 1.1%.
In Labor Force | Age > 16 Correlation Summary
| Measurement | Immigrants from Bahamas | Maltese |
| Minimum | 35.0% | 50.0% |
| Maximum | 89.3% | 81.0% |
| Range | 54.3% | 31.0% |
| Mean | 60.8% | 64.4% |
| Median | 64.0% | 64.3% |
| Interquartile 25% (IQ1) | 56.0% | 61.8% |
| Interquartile 75% (IQ3) | 65.3% | 67.4% |
| Interquartile Range (IQR) | 9.3% | 5.6% |
| Standard Deviation (Sample) | 10.0% | 5.7% |
| Standard Deviation (Population) | 9.9% | 5.7% |
Similar Demographics by In Labor Force | Age > 16
Demographics Similar to Immigrants from Bahamas by In Labor Force | Age > 16
In terms of in labor force | age > 16, the demographic groups most similar to Immigrants from Bahamas are Assyrian/Chaldean/Syriac (64.0%, a difference of 0.020%), Immigrants from Cuba (64.1%, a difference of 0.030%), Mexican (64.1%, a difference of 0.030%), French American Indian (64.1%, a difference of 0.030%), and Native Hawaiian (64.1%, a difference of 0.050%).
| Demographics | Rating | Rank | In Labor Force | Age > 16 |
| Guyanese | 0.4 /100 | #270 | Tragic 64.1% |
| Dominicans | 0.4 /100 | #271 | Tragic 64.1% |
| Native Hawaiians | 0.3 /100 | #272 | Tragic 64.1% |
| Hmong | 0.3 /100 | #273 | Tragic 64.1% |
| Immigrants | Cuba | 0.3 /100 | #274 | Tragic 64.1% |
| Mexicans | 0.3 /100 | #275 | Tragic 64.1% |
| French American Indians | 0.3 /100 | #276 | Tragic 64.1% |
| Immigrants | Bahamas | 0.3 /100 | #277 | Tragic 64.0% |
| Assyrians/Chaldeans/Syriacs | 0.3 /100 | #278 | Tragic 64.0% |
| Welsh | 0.2 /100 | #279 | Tragic 64.0% |
| Immigrants | St. Vincent and the Grenadines | 0.2 /100 | #280 | Tragic 64.0% |
| French Canadians | 0.2 /100 | #281 | Tragic 64.0% |
| Immigrants | Guyana | 0.2 /100 | #282 | Tragic 64.0% |
| Immigrants | Germany | 0.1 /100 | #283 | Tragic 63.9% |
| French | 0.1 /100 | #284 | Tragic 63.9% |
Demographics Similar to Maltese by In Labor Force | Age > 16
In terms of in labor force | age > 16, the demographic groups most similar to Maltese are Alaskan Athabascan (64.8%, a difference of 0.0%), Fijian (64.8%, a difference of 0.010%), Immigrants from Denmark (64.8%, a difference of 0.020%), Estonian (64.8%, a difference of 0.020%), and Immigrants from Trinidad and Tobago (64.8%, a difference of 0.040%).
| Demographics | Rating | Rank | In Labor Force | Age > 16 |
| Lithuanians | 17.4 /100 | #206 | Poor 64.8% |
| Immigrants | Latin America | 16.4 /100 | #207 | Poor 64.8% |
| Belizeans | 16.2 /100 | #208 | Poor 64.8% |
| Immigrants | Trinidad and Tobago | 15.6 /100 | #209 | Poor 64.8% |
| Immigrants | Denmark | 14.7 /100 | #210 | Poor 64.8% |
| Fijians | 14.1 /100 | #211 | Poor 64.8% |
| Alaskan Athabascans | 13.9 /100 | #212 | Poor 64.8% |
| Maltese | 13.8 /100 | #213 | Poor 64.8% |
| Estonians | 13.1 /100 | #214 | Poor 64.8% |
| Immigrants | Czechoslovakia | 12.3 /100 | #215 | Poor 64.8% |
| Belgians | 11.4 /100 | #216 | Poor 64.7% |
| U.S. Virgin Islanders | 11.3 /100 | #217 | Poor 64.7% |
| Alsatians | 10.7 /100 | #218 | Poor 64.7% |
| Immigrants | Central America | 10.5 /100 | #219 | Poor 64.7% |
| Alaska Natives | 9.9 /100 | #220 | Tragic 64.7% |