Immigrants from Armenia vs Inupiat In Labor Force | Age 35-44
COMPARE
Immigrants from Armenia
Inupiat
In Labor Force | Age 35-44
In Labor Force | Age 35-44 Comparison
Immigrants from Armenia
Inupiat
83.7%
IN LABOR FORCE | AGE 35-44
0.9/ 100
METRIC RATING
247th/ 347
METRIC RANK
80.9%
IN LABOR FORCE | AGE 35-44
0.0/ 100
METRIC RATING
319th/ 347
METRIC RANK
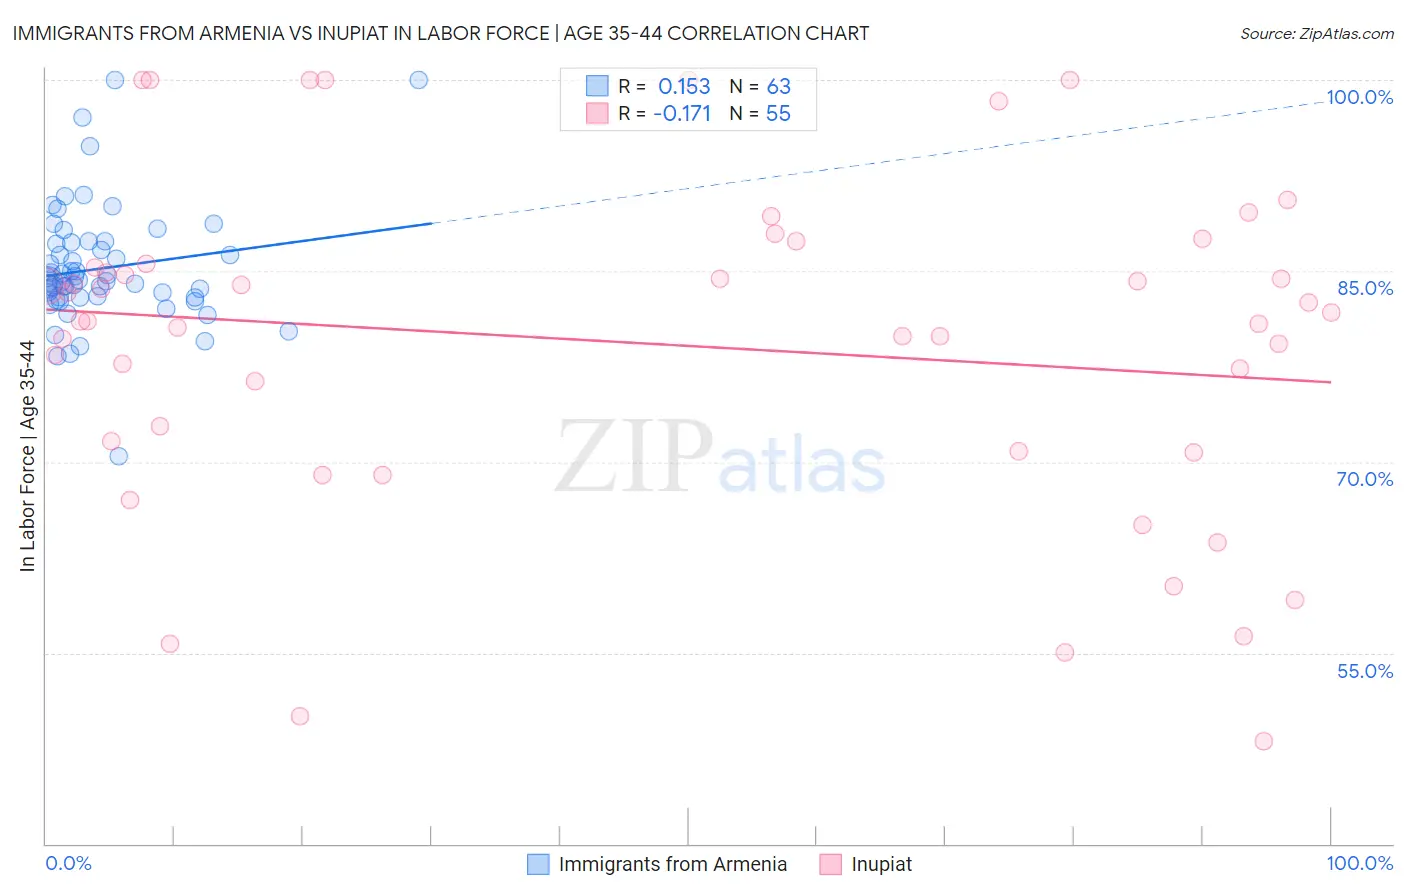
Immigrants from Armenia vs Inupiat In Labor Force | Age 35-44 Correlation Chart
The statistical analysis conducted on geographies consisting of 97,711,872 people shows a poor positive correlation between the proportion of Immigrants from Armenia and labor force participation rate among population between the ages 35 and 44 in the United States with a correlation coefficient (R) of 0.153 and weighted average of 83.7%. Similarly, the statistical analysis conducted on geographies consisting of 96,340,693 people shows a poor negative correlation between the proportion of Inupiat and labor force participation rate among population between the ages 35 and 44 in the United States with a correlation coefficient (R) of -0.171 and weighted average of 80.9%, a difference of 3.4%.
In Labor Force | Age 35-44 Correlation Summary
| Measurement | Immigrants from Armenia | Inupiat |
| Minimum | 70.4% | 48.1% |
| Maximum | 100.0% | 100.0% |
| Range | 29.6% | 51.9% |
| Mean | 85.2% | 79.3% |
| Median | 84.2% | 81.1% |
| Interquartile 25% (IQ1) | 82.9% | 70.8% |
| Interquartile 75% (IQ3) | 87.2% | 85.5% |
| Interquartile Range (IQR) | 4.3% | 14.7% |
| Standard Deviation (Sample) | 4.8% | 13.0% |
| Standard Deviation (Population) | 4.8% | 12.9% |
Similar Demographics by In Labor Force | Age 35-44
Demographics Similar to Immigrants from Armenia by In Labor Force | Age 35-44
In terms of in labor force | age 35-44, the demographic groups most similar to Immigrants from Armenia are Immigrants (83.7%, a difference of 0.020%), Indonesian (83.7%, a difference of 0.020%), Immigrants from Western Asia (83.8%, a difference of 0.030%), Guyanese (83.8%, a difference of 0.030%), and Malaysian (83.8%, a difference of 0.030%).
| Demographics | Rating | Rank | In Labor Force | Age 35-44 |
| Arabs | 1.3 /100 | #240 | Tragic 83.8% |
| Iraqis | 1.3 /100 | #241 | Tragic 83.8% |
| Immigrants | Cambodia | 1.1 /100 | #242 | Tragic 83.8% |
| Immigrants | Western Asia | 1.1 /100 | #243 | Tragic 83.8% |
| Guyanese | 1.1 /100 | #244 | Tragic 83.8% |
| Malaysians | 1.1 /100 | #245 | Tragic 83.8% |
| Immigrants | Immigrants | 1.0 /100 | #246 | Tragic 83.7% |
| Immigrants | Armenia | 0.9 /100 | #247 | Tragic 83.7% |
| Indonesians | 0.8 /100 | #248 | Tragic 83.7% |
| Immigrants | St. Vincent and the Grenadines | 0.7 /100 | #249 | Tragic 83.7% |
| Whites/Caucasians | 0.5 /100 | #250 | Tragic 83.6% |
| Salvadorans | 0.4 /100 | #251 | Tragic 83.6% |
| Immigrants | Guyana | 0.4 /100 | #252 | Tragic 83.6% |
| Lebanese | 0.4 /100 | #253 | Tragic 83.6% |
| Tongans | 0.4 /100 | #254 | Tragic 83.6% |
Demographics Similar to Inupiat by In Labor Force | Age 35-44
In terms of in labor force | age 35-44, the demographic groups most similar to Inupiat are Chickasaw (80.9%, a difference of 0.050%), Puerto Rican (80.7%, a difference of 0.33%), Paiute (80.6%, a difference of 0.40%), Alaskan Athabascan (81.3%, a difference of 0.44%), and Yaqui (80.5%, a difference of 0.51%).
| Demographics | Rating | Rank | In Labor Force | Age 35-44 |
| Alaska Natives | 0.0 /100 | #312 | Tragic 81.6% |
| Mexicans | 0.0 /100 | #313 | Tragic 81.6% |
| Cajuns | 0.0 /100 | #314 | Tragic 81.5% |
| Immigrants | Mexico | 0.0 /100 | #315 | Tragic 81.5% |
| Comanche | 0.0 /100 | #316 | Tragic 81.5% |
| Cherokee | 0.0 /100 | #317 | Tragic 81.4% |
| Alaskan Athabascans | 0.0 /100 | #318 | Tragic 81.3% |
| Inupiat | 0.0 /100 | #319 | Tragic 80.9% |
| Chickasaw | 0.0 /100 | #320 | Tragic 80.9% |
| Puerto Ricans | 0.0 /100 | #321 | Tragic 80.7% |
| Paiute | 0.0 /100 | #322 | Tragic 80.6% |
| Yaqui | 0.0 /100 | #323 | Tragic 80.5% |
| Choctaw | 0.0 /100 | #324 | Tragic 80.5% |
| Dutch West Indians | 0.0 /100 | #325 | Tragic 80.4% |
| Seminole | 0.0 /100 | #326 | Tragic 80.4% |