Immigrants from Armenia vs Inupiat Unemployment Among Ages 55 to 59 years
COMPARE
Immigrants from Armenia
Inupiat
Unemployment Among Ages 55 to 59 years
Unemployment Among Ages 55 to 59 years Comparison
Immigrants from Armenia
Inupiat
6.0%
UNEMPLOYMENT AMONG AGES 55 TO 59 YEARS
0.0/ 100
METRIC RATING
325th/ 347
METRIC RANK
9.0%
UNEMPLOYMENT AMONG AGES 55 TO 59 YEARS
0.0/ 100
METRIC RATING
344th/ 347
METRIC RANK
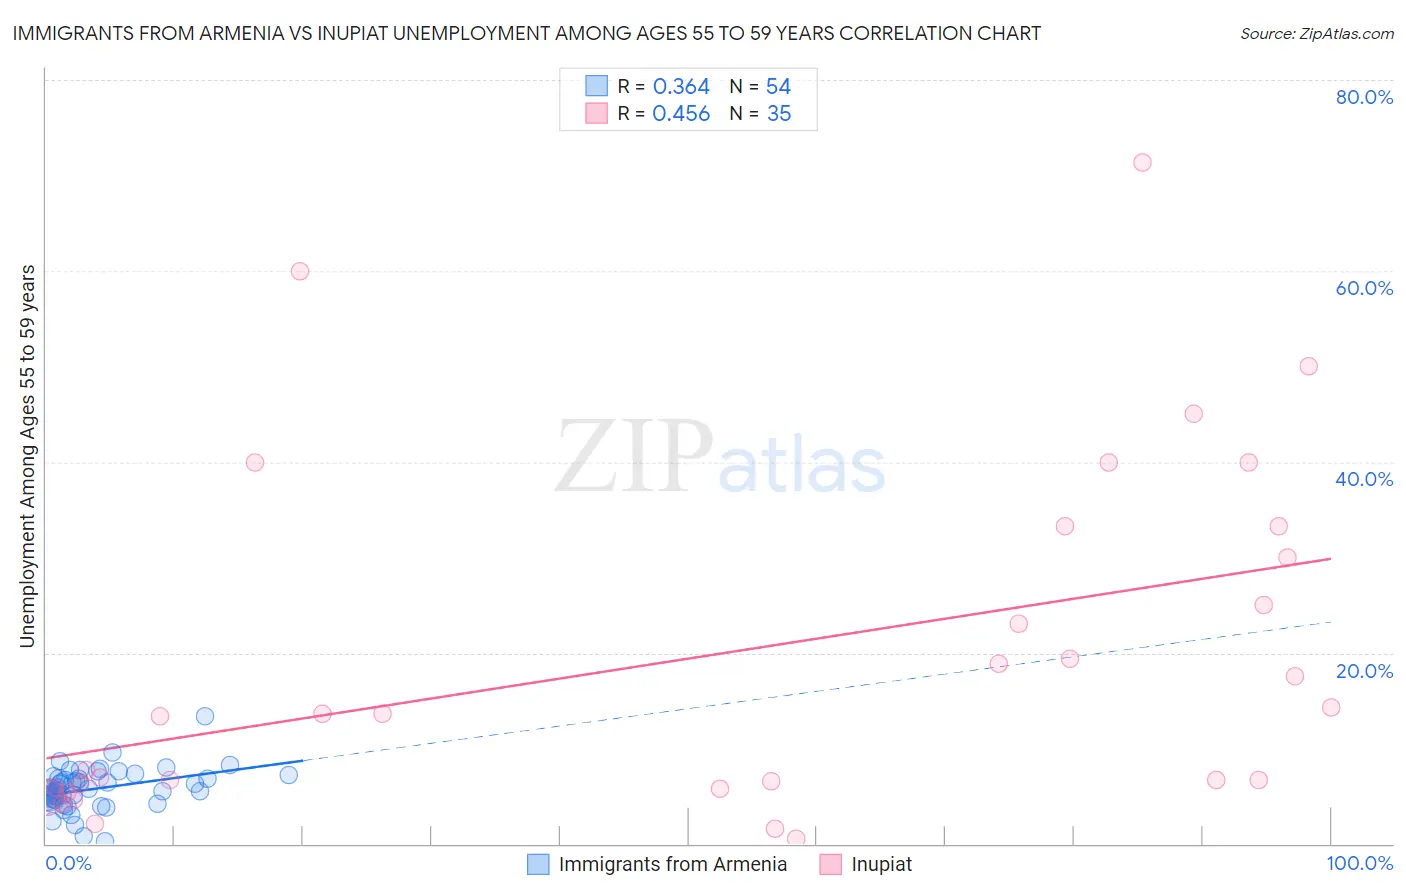
Immigrants from Armenia vs Inupiat Unemployment Among Ages 55 to 59 years Correlation Chart
The statistical analysis conducted on geographies consisting of 96,295,490 people shows a mild positive correlation between the proportion of Immigrants from Armenia and unemployment rate among population between the ages 55 and 59 in the United States with a correlation coefficient (R) of 0.364 and weighted average of 6.0%. Similarly, the statistical analysis conducted on geographies consisting of 93,729,487 people shows a moderate positive correlation between the proportion of Inupiat and unemployment rate among population between the ages 55 and 59 in the United States with a correlation coefficient (R) of 0.456 and weighted average of 9.0%, a difference of 51.1%.
Unemployment Among Ages 55 to 59 years Correlation Summary
| Measurement | Immigrants from Armenia | Inupiat |
| Minimum | 0.20% | 0.50% |
| Maximum | 13.4% | 71.4% |
| Range | 13.2% | 70.9% |
| Mean | 5.7% | 19.5% |
| Median | 5.7% | 13.6% |
| Interquartile 25% (IQ1) | 4.7% | 6.0% |
| Interquartile 75% (IQ3) | 6.8% | 33.3% |
| Interquartile Range (IQR) | 2.1% | 27.3% |
| Standard Deviation (Sample) | 2.1% | 18.2% |
| Standard Deviation (Population) | 2.1% | 17.9% |
Demographics Similar to Immigrants from Armenia and Inupiat by Unemployment Among Ages 55 to 59 years
In terms of unemployment among ages 55 to 59 years, the demographic groups most similar to Immigrants from Armenia are Native/Alaskan (6.0%, a difference of 0.37%), Arapaho (6.1%, a difference of 1.3%), Vietnamese (5.9%, a difference of 1.8%), Yuman (6.1%, a difference of 2.5%), and Dominican (6.2%, a difference of 3.9%). Similarly, the demographic groups most similar to Inupiat are Yakama (8.9%, a difference of 1.2%), Hopi (8.1%, a difference of 11.3%), Shoshone (7.4%, a difference of 22.6%), Alaskan Athabascan (7.1%, a difference of 26.7%), and Puerto Rican (7.0%, a difference of 29.8%).
| Demographics | Rating | Rank | Unemployment Among Ages 55 to 59 years |
| Vietnamese | 0.0 /100 | #324 | Tragic 5.9% |
| Immigrants | Armenia | 0.0 /100 | #325 | Tragic 6.0% |
| Natives/Alaskans | 0.0 /100 | #326 | Tragic 6.0% |
| Arapaho | 0.0 /100 | #327 | Tragic 6.1% |
| Yuman | 0.0 /100 | #328 | Tragic 6.1% |
| Dominicans | 0.0 /100 | #329 | Tragic 6.2% |
| Alaska Natives | 0.0 /100 | #330 | Tragic 6.2% |
| Immigrants | Dominican Republic | 0.0 /100 | #331 | Tragic 6.3% |
| Aleuts | 0.0 /100 | #332 | Tragic 6.4% |
| Pima | 0.0 /100 | #333 | Tragic 6.6% |
| Pueblo | 0.0 /100 | #334 | Tragic 6.7% |
| Colville | 0.0 /100 | #335 | Tragic 6.7% |
| Navajo | 0.0 /100 | #336 | Tragic 6.7% |
| Paiute | 0.0 /100 | #337 | Tragic 6.8% |
| Immigrants | Yemen | 0.0 /100 | #338 | Tragic 6.9% |
| Puerto Ricans | 0.0 /100 | #339 | Tragic 7.0% |
| Alaskan Athabascans | 0.0 /100 | #340 | Tragic 7.1% |
| Shoshone | 0.0 /100 | #341 | Tragic 7.4% |
| Hopi | 0.0 /100 | #342 | Tragic 8.1% |
| Yakama | 0.0 /100 | #343 | Tragic 8.9% |
| Inupiat | 0.0 /100 | #344 | Tragic 9.0% |