Immigrants from Armenia vs Sudanese In Labor Force | Age 35-44
COMPARE
Immigrants from Armenia
Sudanese
In Labor Force | Age 35-44
In Labor Force | Age 35-44 Comparison
Immigrants from Armenia
Sudanese
83.7%
IN LABOR FORCE | AGE 35-44
0.9/ 100
METRIC RATING
247th/ 347
METRIC RANK
85.0%
IN LABOR FORCE | AGE 35-44
99.0/ 100
METRIC RATING
69th/ 347
METRIC RANK
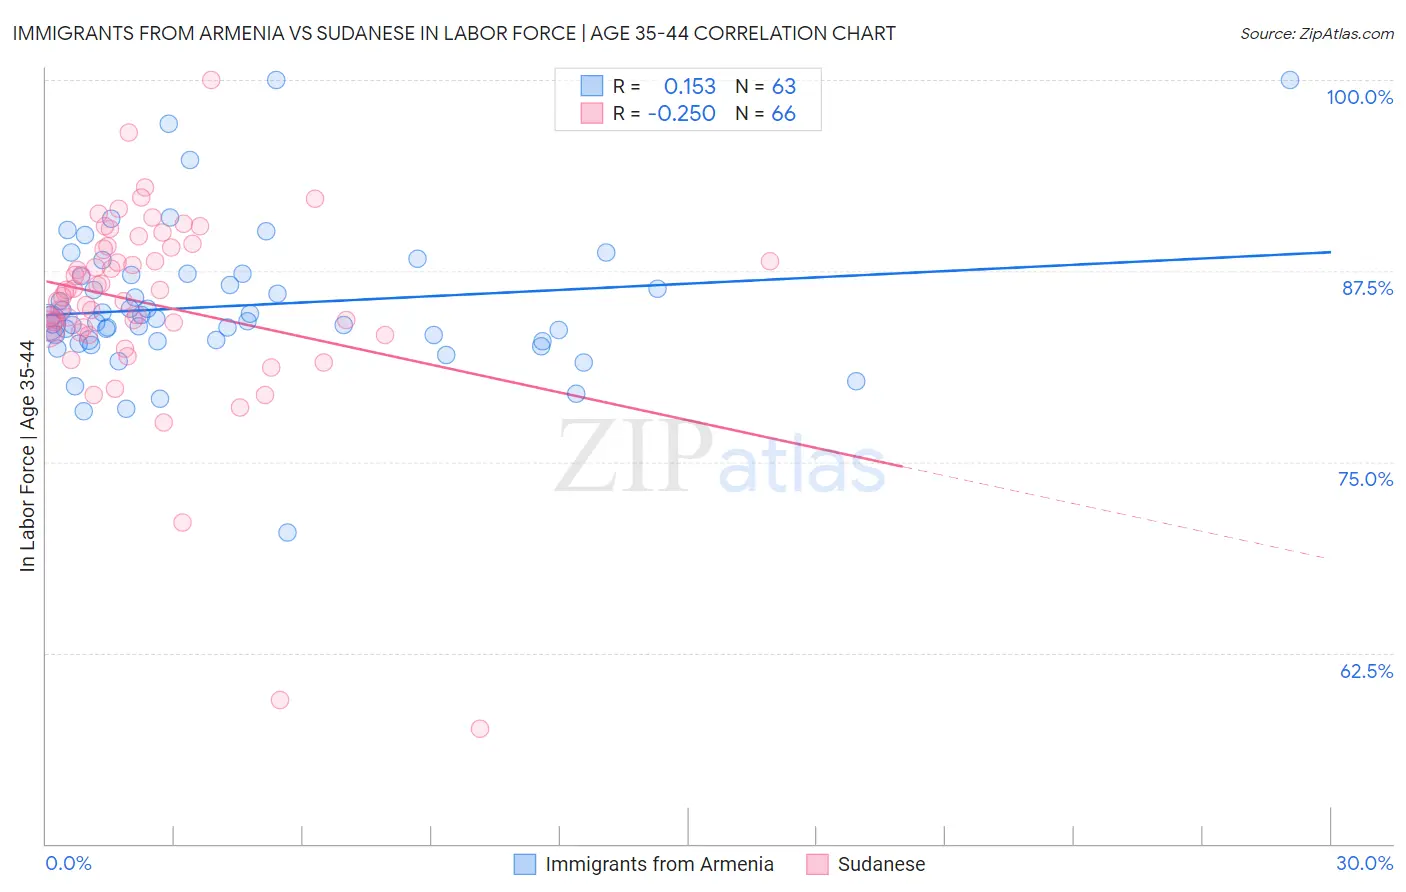
Immigrants from Armenia vs Sudanese In Labor Force | Age 35-44 Correlation Chart
The statistical analysis conducted on geographies consisting of 97,711,872 people shows a poor positive correlation between the proportion of Immigrants from Armenia and labor force participation rate among population between the ages 35 and 44 in the United States with a correlation coefficient (R) of 0.153 and weighted average of 83.7%. Similarly, the statistical analysis conducted on geographies consisting of 110,129,282 people shows a weak negative correlation between the proportion of Sudanese and labor force participation rate among population between the ages 35 and 44 in the United States with a correlation coefficient (R) of -0.250 and weighted average of 85.0%, a difference of 1.5%.
In Labor Force | Age 35-44 Correlation Summary
| Measurement | Immigrants from Armenia | Sudanese |
| Minimum | 70.4% | 57.5% |
| Maximum | 100.0% | 100.0% |
| Range | 29.6% | 42.5% |
| Mean | 85.2% | 85.3% |
| Median | 84.2% | 85.9% |
| Interquartile 25% (IQ1) | 82.9% | 83.5% |
| Interquartile 75% (IQ3) | 87.2% | 89.0% |
| Interquartile Range (IQR) | 4.3% | 5.5% |
| Standard Deviation (Sample) | 4.8% | 6.6% |
| Standard Deviation (Population) | 4.8% | 6.5% |
Similar Demographics by In Labor Force | Age 35-44
Demographics Similar to Immigrants from Armenia by In Labor Force | Age 35-44
In terms of in labor force | age 35-44, the demographic groups most similar to Immigrants from Armenia are Immigrants (83.7%, a difference of 0.020%), Indonesian (83.7%, a difference of 0.020%), Immigrants from Western Asia (83.8%, a difference of 0.030%), Guyanese (83.8%, a difference of 0.030%), and Malaysian (83.8%, a difference of 0.030%).
| Demographics | Rating | Rank | In Labor Force | Age 35-44 |
| Arabs | 1.3 /100 | #240 | Tragic 83.8% |
| Iraqis | 1.3 /100 | #241 | Tragic 83.8% |
| Immigrants | Cambodia | 1.1 /100 | #242 | Tragic 83.8% |
| Immigrants | Western Asia | 1.1 /100 | #243 | Tragic 83.8% |
| Guyanese | 1.1 /100 | #244 | Tragic 83.8% |
| Malaysians | 1.1 /100 | #245 | Tragic 83.8% |
| Immigrants | Immigrants | 1.0 /100 | #246 | Tragic 83.7% |
| Immigrants | Armenia | 0.9 /100 | #247 | Tragic 83.7% |
| Indonesians | 0.8 /100 | #248 | Tragic 83.7% |
| Immigrants | St. Vincent and the Grenadines | 0.7 /100 | #249 | Tragic 83.7% |
| Whites/Caucasians | 0.5 /100 | #250 | Tragic 83.6% |
| Salvadorans | 0.4 /100 | #251 | Tragic 83.6% |
| Immigrants | Guyana | 0.4 /100 | #252 | Tragic 83.6% |
| Lebanese | 0.4 /100 | #253 | Tragic 83.6% |
| Tongans | 0.4 /100 | #254 | Tragic 83.6% |
Demographics Similar to Sudanese by In Labor Force | Age 35-44
In terms of in labor force | age 35-44, the demographic groups most similar to Sudanese are Brazilian (85.0%, a difference of 0.0%), Immigrants from Italy (85.0%, a difference of 0.010%), Italian (85.0%, a difference of 0.010%), Russian (85.0%, a difference of 0.010%), and Immigrants from Haiti (85.0%, a difference of 0.020%).
| Demographics | Rating | Rank | In Labor Force | Age 35-44 |
| Immigrants | Moldova | 99.3 /100 | #62 | Exceptional 85.0% |
| Immigrants | Uganda | 99.3 /100 | #63 | Exceptional 85.0% |
| Swedes | 99.2 /100 | #64 | Exceptional 85.0% |
| Immigrants | Brazil | 99.2 /100 | #65 | Exceptional 85.0% |
| Immigrants | Haiti | 99.1 /100 | #66 | Exceptional 85.0% |
| Immigrants | Italy | 99.1 /100 | #67 | Exceptional 85.0% |
| Italians | 99.1 /100 | #68 | Exceptional 85.0% |
| Sudanese | 99.0 /100 | #69 | Exceptional 85.0% |
| Brazilians | 99.0 /100 | #70 | Exceptional 85.0% |
| Russians | 99.0 /100 | #71 | Exceptional 85.0% |
| Immigrants | Singapore | 98.9 /100 | #72 | Exceptional 85.0% |
| Immigrants | Sri Lanka | 98.9 /100 | #73 | Exceptional 85.0% |
| Colombians | 98.8 /100 | #74 | Exceptional 85.0% |
| Immigrants | South Central Asia | 98.7 /100 | #75 | Exceptional 85.0% |
| Immigrants | Cuba | 98.6 /100 | #76 | Exceptional 84.9% |