Immigrants from Armenia vs Tohono O'odham In Labor Force | Age 35-44
COMPARE
Immigrants from Armenia
Tohono O'odham
In Labor Force | Age 35-44
In Labor Force | Age 35-44 Comparison
Immigrants from Armenia
Tohono O'odham
83.7%
IN LABOR FORCE | AGE 35-44
0.9/ 100
METRIC RATING
247th/ 347
METRIC RANK
74.1%
IN LABOR FORCE | AGE 35-44
0.0/ 100
METRIC RATING
346th/ 347
METRIC RANK
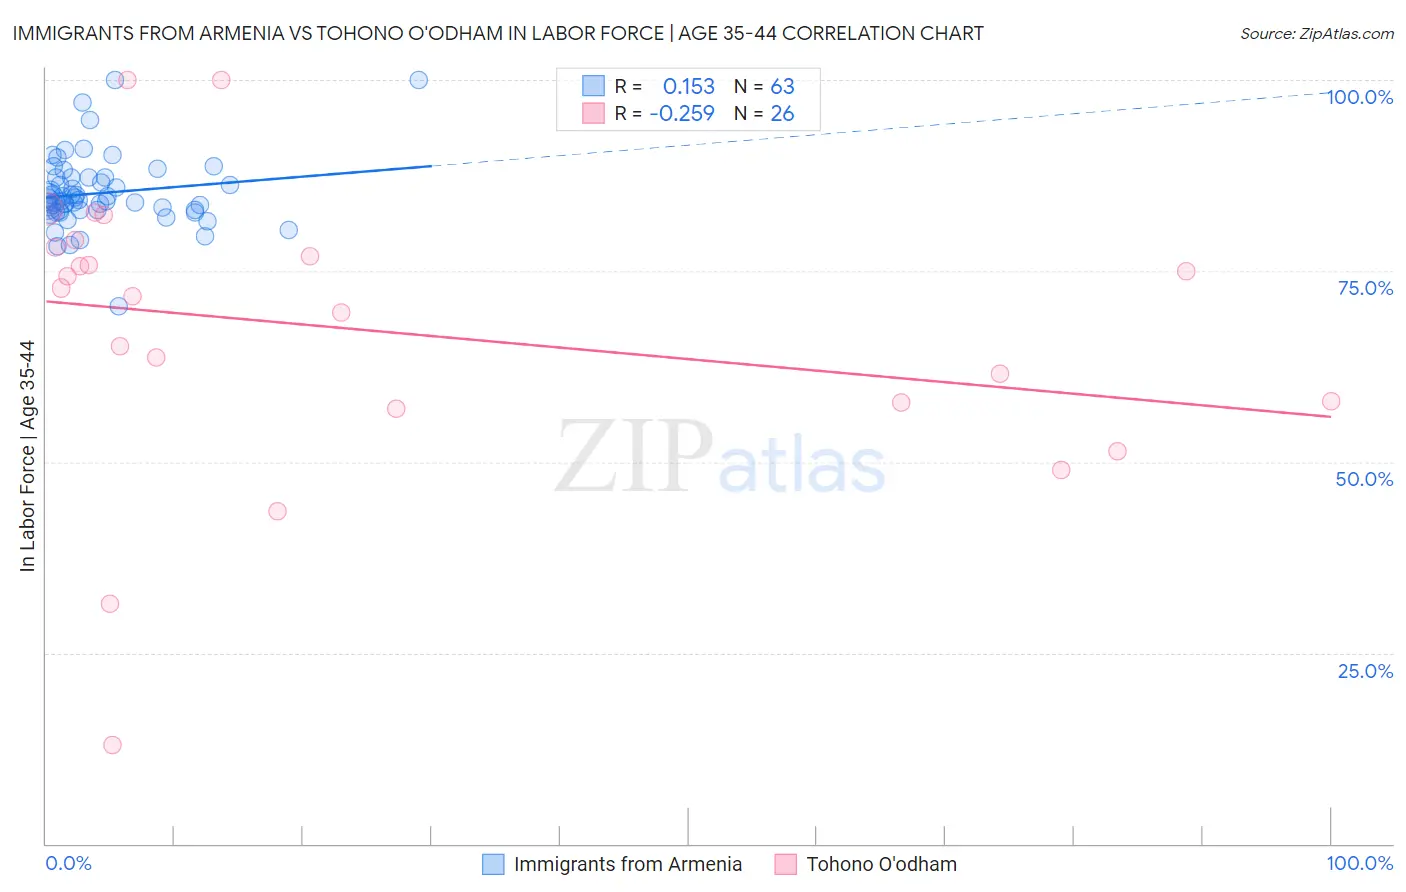
Immigrants from Armenia vs Tohono O'odham In Labor Force | Age 35-44 Correlation Chart
The statistical analysis conducted on geographies consisting of 97,711,872 people shows a poor positive correlation between the proportion of Immigrants from Armenia and labor force participation rate among population between the ages 35 and 44 in the United States with a correlation coefficient (R) of 0.153 and weighted average of 83.7%. Similarly, the statistical analysis conducted on geographies consisting of 58,719,465 people shows a weak negative correlation between the proportion of Tohono O'odham and labor force participation rate among population between the ages 35 and 44 in the United States with a correlation coefficient (R) of -0.259 and weighted average of 74.1%, a difference of 13.0%.
In Labor Force | Age 35-44 Correlation Summary
| Measurement | Immigrants from Armenia | Tohono O'odham |
| Minimum | 70.4% | 13.0% |
| Maximum | 100.0% | 100.0% |
| Range | 29.6% | 87.0% |
| Mean | 85.2% | 67.2% |
| Median | 84.2% | 72.2% |
| Interquartile 25% (IQ1) | 82.9% | 57.8% |
| Interquartile 75% (IQ3) | 87.2% | 78.1% |
| Interquartile Range (IQR) | 4.3% | 20.3% |
| Standard Deviation (Sample) | 4.8% | 19.2% |
| Standard Deviation (Population) | 4.8% | 18.8% |
Similar Demographics by In Labor Force | Age 35-44
Demographics Similar to Immigrants from Armenia by In Labor Force | Age 35-44
In terms of in labor force | age 35-44, the demographic groups most similar to Immigrants from Armenia are Immigrants (83.7%, a difference of 0.020%), Indonesian (83.7%, a difference of 0.020%), Immigrants from Western Asia (83.8%, a difference of 0.030%), Guyanese (83.8%, a difference of 0.030%), and Malaysian (83.8%, a difference of 0.030%).
| Demographics | Rating | Rank | In Labor Force | Age 35-44 |
| Arabs | 1.3 /100 | #240 | Tragic 83.8% |
| Iraqis | 1.3 /100 | #241 | Tragic 83.8% |
| Immigrants | Cambodia | 1.1 /100 | #242 | Tragic 83.8% |
| Immigrants | Western Asia | 1.1 /100 | #243 | Tragic 83.8% |
| Guyanese | 1.1 /100 | #244 | Tragic 83.8% |
| Malaysians | 1.1 /100 | #245 | Tragic 83.8% |
| Immigrants | Immigrants | 1.0 /100 | #246 | Tragic 83.7% |
| Immigrants | Armenia | 0.9 /100 | #247 | Tragic 83.7% |
| Indonesians | 0.8 /100 | #248 | Tragic 83.7% |
| Immigrants | St. Vincent and the Grenadines | 0.7 /100 | #249 | Tragic 83.7% |
| Whites/Caucasians | 0.5 /100 | #250 | Tragic 83.6% |
| Salvadorans | 0.4 /100 | #251 | Tragic 83.6% |
| Immigrants | Guyana | 0.4 /100 | #252 | Tragic 83.6% |
| Lebanese | 0.4 /100 | #253 | Tragic 83.6% |
| Tongans | 0.4 /100 | #254 | Tragic 83.6% |
Demographics Similar to Tohono O'odham by In Labor Force | Age 35-44
In terms of in labor force | age 35-44, the demographic groups most similar to Tohono O'odham are Navajo (73.8%, a difference of 0.38%), Yuman (74.7%, a difference of 0.83%), Pima (74.8%, a difference of 0.96%), Immigrants from Yemen (76.3%, a difference of 2.9%), and Crow (76.5%, a difference of 3.2%).
| Demographics | Rating | Rank | In Labor Force | Age 35-44 |
| Kiowa | 0.0 /100 | #333 | Tragic 79.2% |
| Yakama | 0.0 /100 | #334 | Tragic 79.0% |
| Natives/Alaskans | 0.0 /100 | #335 | Tragic 78.9% |
| Arapaho | 0.0 /100 | #336 | Tragic 78.1% |
| Apache | 0.0 /100 | #337 | Tragic 77.9% |
| Pueblo | 0.0 /100 | #338 | Tragic 77.4% |
| Yup'ik | 0.0 /100 | #339 | Tragic 77.3% |
| Lumbee | 0.0 /100 | #340 | Tragic 77.0% |
| Hopi | 0.0 /100 | #341 | Tragic 77.0% |
| Crow | 0.0 /100 | #342 | Tragic 76.5% |
| Immigrants | Yemen | 0.0 /100 | #343 | Tragic 76.3% |
| Pima | 0.0 /100 | #344 | Tragic 74.8% |
| Yuman | 0.0 /100 | #345 | Tragic 74.7% |
| Tohono O'odham | 0.0 /100 | #346 | Tragic 74.1% |
| Navajo | 0.0 /100 | #347 | Tragic 73.8% |