Immigrants from Europe vs Inupiat In Labor Force | Age 35-44
COMPARE
Immigrants from Europe
Inupiat
In Labor Force | Age 35-44
In Labor Force | Age 35-44 Comparison
Immigrants from Europe
Inupiat
84.9%
IN LABOR FORCE | AGE 35-44
97.2/ 100
METRIC RATING
91st/ 347
METRIC RANK
80.9%
IN LABOR FORCE | AGE 35-44
0.0/ 100
METRIC RATING
319th/ 347
METRIC RANK
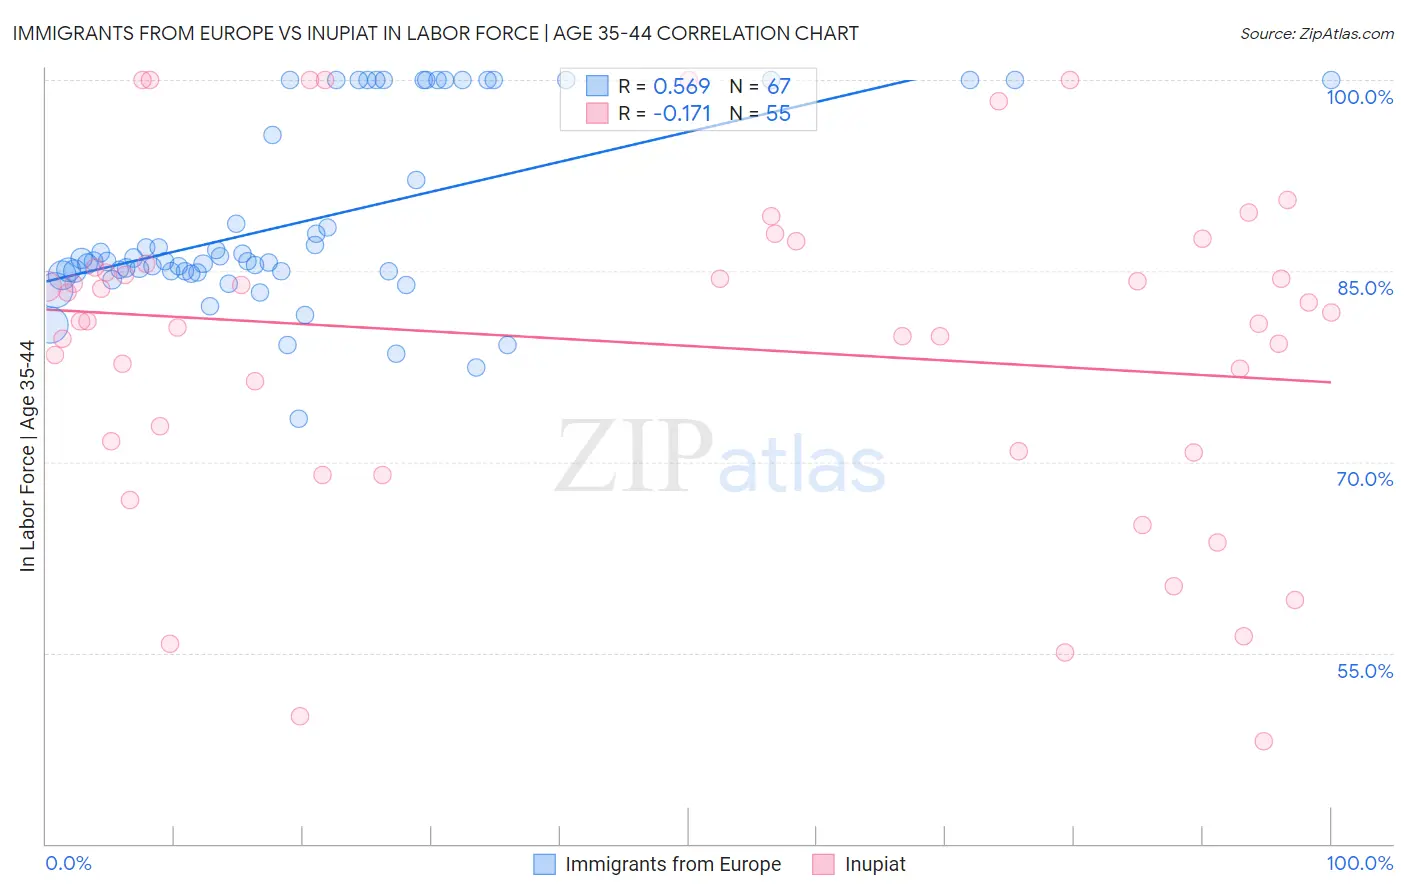
Immigrants from Europe vs Inupiat In Labor Force | Age 35-44 Correlation Chart
The statistical analysis conducted on geographies consisting of 546,881,574 people shows a substantial positive correlation between the proportion of Immigrants from Europe and labor force participation rate among population between the ages 35 and 44 in the United States with a correlation coefficient (R) of 0.569 and weighted average of 84.9%. Similarly, the statistical analysis conducted on geographies consisting of 96,340,693 people shows a poor negative correlation between the proportion of Inupiat and labor force participation rate among population between the ages 35 and 44 in the United States with a correlation coefficient (R) of -0.171 and weighted average of 80.9%, a difference of 4.8%.
In Labor Force | Age 35-44 Correlation Summary
| Measurement | Immigrants from Europe | Inupiat |
| Minimum | 73.4% | 48.1% |
| Maximum | 100.0% | 100.0% |
| Range | 26.6% | 51.9% |
| Mean | 88.9% | 79.3% |
| Median | 85.7% | 81.1% |
| Interquartile 25% (IQ1) | 84.9% | 70.8% |
| Interquartile 75% (IQ3) | 100.0% | 85.5% |
| Interquartile Range (IQR) | 15.1% | 14.7% |
| Standard Deviation (Sample) | 7.4% | 13.0% |
| Standard Deviation (Population) | 7.3% | 12.9% |
Similar Demographics by In Labor Force | Age 35-44
Demographics Similar to Immigrants from Europe by In Labor Force | Age 35-44
In terms of in labor force | age 35-44, the demographic groups most similar to Immigrants from Europe are Ghanaian (84.8%, a difference of 0.0%), Immigrants from France (84.9%, a difference of 0.010%), Immigrants from Northern Africa (84.8%, a difference of 0.010%), Immigrants from Pakistan (84.9%, a difference of 0.020%), and Mongolian (84.8%, a difference of 0.020%).
| Demographics | Rating | Rank | In Labor Force | Age 35-44 |
| Immigrants | Peru | 97.8 /100 | #84 | Exceptional 84.9% |
| Immigrants | Middle Africa | 97.8 /100 | #85 | Exceptional 84.9% |
| Greeks | 97.8 /100 | #86 | Exceptional 84.9% |
| Belgians | 97.7 /100 | #87 | Exceptional 84.9% |
| Yugoslavians | 97.7 /100 | #88 | Exceptional 84.9% |
| Immigrants | Pakistan | 97.5 /100 | #89 | Exceptional 84.9% |
| Immigrants | France | 97.4 /100 | #90 | Exceptional 84.9% |
| Immigrants | Europe | 97.2 /100 | #91 | Exceptional 84.9% |
| Ghanaians | 97.2 /100 | #92 | Exceptional 84.8% |
| Immigrants | Northern Africa | 97.1 /100 | #93 | Exceptional 84.8% |
| Mongolians | 96.8 /100 | #94 | Exceptional 84.8% |
| Immigrants | Kuwait | 96.7 /100 | #95 | Exceptional 84.8% |
| Cubans | 96.6 /100 | #96 | Exceptional 84.8% |
| Egyptians | 96.6 /100 | #97 | Exceptional 84.8% |
| Indians (Asian) | 96.1 /100 | #98 | Exceptional 84.8% |
Demographics Similar to Inupiat by In Labor Force | Age 35-44
In terms of in labor force | age 35-44, the demographic groups most similar to Inupiat are Chickasaw (80.9%, a difference of 0.050%), Puerto Rican (80.7%, a difference of 0.33%), Paiute (80.6%, a difference of 0.40%), Alaskan Athabascan (81.3%, a difference of 0.44%), and Yaqui (80.5%, a difference of 0.51%).
| Demographics | Rating | Rank | In Labor Force | Age 35-44 |
| Alaska Natives | 0.0 /100 | #312 | Tragic 81.6% |
| Mexicans | 0.0 /100 | #313 | Tragic 81.6% |
| Cajuns | 0.0 /100 | #314 | Tragic 81.5% |
| Immigrants | Mexico | 0.0 /100 | #315 | Tragic 81.5% |
| Comanche | 0.0 /100 | #316 | Tragic 81.5% |
| Cherokee | 0.0 /100 | #317 | Tragic 81.4% |
| Alaskan Athabascans | 0.0 /100 | #318 | Tragic 81.3% |
| Inupiat | 0.0 /100 | #319 | Tragic 80.9% |
| Chickasaw | 0.0 /100 | #320 | Tragic 80.9% |
| Puerto Ricans | 0.0 /100 | #321 | Tragic 80.7% |
| Paiute | 0.0 /100 | #322 | Tragic 80.6% |
| Yaqui | 0.0 /100 | #323 | Tragic 80.5% |
| Choctaw | 0.0 /100 | #324 | Tragic 80.5% |
| Dutch West Indians | 0.0 /100 | #325 | Tragic 80.4% |
| Seminole | 0.0 /100 | #326 | Tragic 80.4% |