Immigrants from Morocco vs Inupiat In Labor Force | Age 35-44
COMPARE
Immigrants from Morocco
Inupiat
In Labor Force | Age 35-44
In Labor Force | Age 35-44 Comparison
Immigrants from Morocco
Inupiat
85.2%
IN LABOR FORCE | AGE 35-44
99.8/ 100
METRIC RATING
36th/ 347
METRIC RANK
80.9%
IN LABOR FORCE | AGE 35-44
0.0/ 100
METRIC RATING
319th/ 347
METRIC RANK
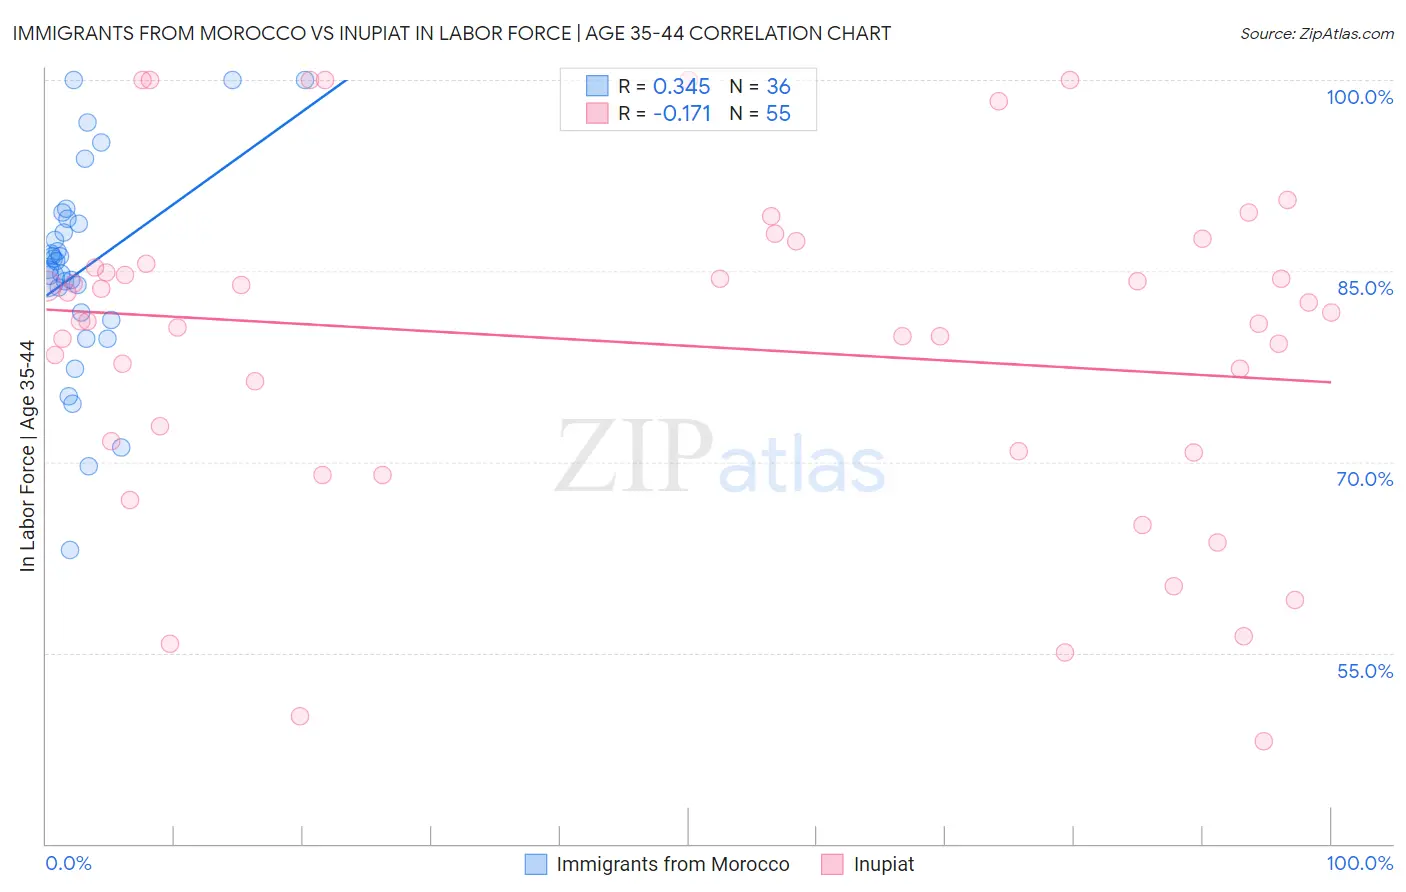
Immigrants from Morocco vs Inupiat In Labor Force | Age 35-44 Correlation Chart
The statistical analysis conducted on geographies consisting of 178,909,040 people shows a mild positive correlation between the proportion of Immigrants from Morocco and labor force participation rate among population between the ages 35 and 44 in the United States with a correlation coefficient (R) of 0.345 and weighted average of 85.2%. Similarly, the statistical analysis conducted on geographies consisting of 96,340,693 people shows a poor negative correlation between the proportion of Inupiat and labor force participation rate among population between the ages 35 and 44 in the United States with a correlation coefficient (R) of -0.171 and weighted average of 80.9%, a difference of 5.3%.
In Labor Force | Age 35-44 Correlation Summary
| Measurement | Immigrants from Morocco | Inupiat |
| Minimum | 63.1% | 48.1% |
| Maximum | 100.0% | 100.0% |
| Range | 36.9% | 51.9% |
| Mean | 85.1% | 79.3% |
| Median | 85.5% | 81.1% |
| Interquartile 25% (IQ1) | 81.4% | 70.8% |
| Interquartile 75% (IQ3) | 88.9% | 85.5% |
| Interquartile Range (IQR) | 7.5% | 14.7% |
| Standard Deviation (Sample) | 8.2% | 13.0% |
| Standard Deviation (Population) | 8.1% | 12.9% |
Similar Demographics by In Labor Force | Age 35-44
Demographics Similar to Immigrants from Morocco by In Labor Force | Age 35-44
In terms of in labor force | age 35-44, the demographic groups most similar to Immigrants from Morocco are Kenyan (85.2%, a difference of 0.010%), Immigrants from Poland (85.2%, a difference of 0.020%), Eastern European (85.2%, a difference of 0.020%), Immigrants from Nepal (85.3%, a difference of 0.030%), and Estonian (85.3%, a difference of 0.030%).
| Demographics | Rating | Rank | In Labor Force | Age 35-44 |
| Cambodians | 99.9 /100 | #29 | Exceptional 85.3% |
| Bermudans | 99.9 /100 | #30 | Exceptional 85.3% |
| Czechs | 99.9 /100 | #31 | Exceptional 85.3% |
| Immigrants | India | 99.9 /100 | #32 | Exceptional 85.3% |
| Ugandans | 99.9 /100 | #33 | Exceptional 85.3% |
| Immigrants | Nepal | 99.9 /100 | #34 | Exceptional 85.3% |
| Estonians | 99.9 /100 | #35 | Exceptional 85.3% |
| Immigrants | Morocco | 99.8 /100 | #36 | Exceptional 85.2% |
| Kenyans | 99.8 /100 | #37 | Exceptional 85.2% |
| Immigrants | Poland | 99.8 /100 | #38 | Exceptional 85.2% |
| Eastern Europeans | 99.8 /100 | #39 | Exceptional 85.2% |
| Immigrants | Bulgaria | 99.8 /100 | #40 | Exceptional 85.2% |
| Immigrants | Zimbabwe | 99.8 /100 | #41 | Exceptional 85.2% |
| Macedonians | 99.8 /100 | #42 | Exceptional 85.2% |
| Poles | 99.8 /100 | #43 | Exceptional 85.2% |
Demographics Similar to Inupiat by In Labor Force | Age 35-44
In terms of in labor force | age 35-44, the demographic groups most similar to Inupiat are Chickasaw (80.9%, a difference of 0.050%), Puerto Rican (80.7%, a difference of 0.33%), Paiute (80.6%, a difference of 0.40%), Alaskan Athabascan (81.3%, a difference of 0.44%), and Yaqui (80.5%, a difference of 0.51%).
| Demographics | Rating | Rank | In Labor Force | Age 35-44 |
| Alaska Natives | 0.0 /100 | #312 | Tragic 81.6% |
| Mexicans | 0.0 /100 | #313 | Tragic 81.6% |
| Cajuns | 0.0 /100 | #314 | Tragic 81.5% |
| Immigrants | Mexico | 0.0 /100 | #315 | Tragic 81.5% |
| Comanche | 0.0 /100 | #316 | Tragic 81.5% |
| Cherokee | 0.0 /100 | #317 | Tragic 81.4% |
| Alaskan Athabascans | 0.0 /100 | #318 | Tragic 81.3% |
| Inupiat | 0.0 /100 | #319 | Tragic 80.9% |
| Chickasaw | 0.0 /100 | #320 | Tragic 80.9% |
| Puerto Ricans | 0.0 /100 | #321 | Tragic 80.7% |
| Paiute | 0.0 /100 | #322 | Tragic 80.6% |
| Yaqui | 0.0 /100 | #323 | Tragic 80.5% |
| Choctaw | 0.0 /100 | #324 | Tragic 80.5% |
| Dutch West Indians | 0.0 /100 | #325 | Tragic 80.4% |
| Seminole | 0.0 /100 | #326 | Tragic 80.4% |