Immigrants from Argentina vs Immigrants from Zaire In Labor Force | Age 16-19
COMPARE
Immigrants from Argentina
Immigrants from Zaire
In Labor Force | Age 16-19
In Labor Force | Age 16-19 Comparison
Immigrants from Argentina
Immigrants from Zaire
32.9%
IN LABOR FORCE | AGE 16-19
0.0/ 100
METRIC RATING
300th/ 347
METRIC RANK
40.7%
IN LABOR FORCE | AGE 16-19
100.0/ 100
METRIC RATING
51st/ 347
METRIC RANK
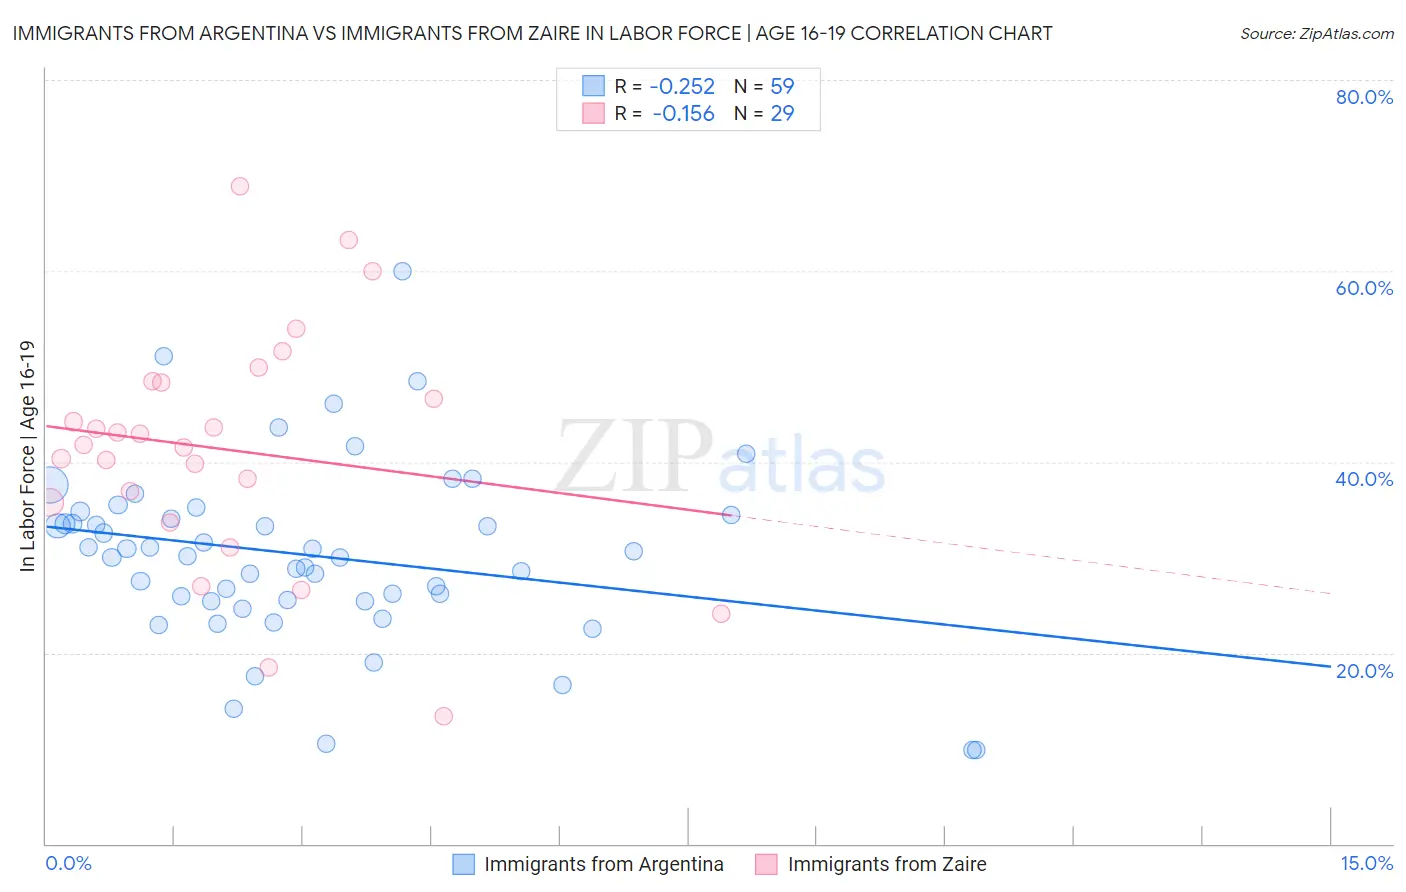
Immigrants from Argentina vs Immigrants from Zaire In Labor Force | Age 16-19 Correlation Chart
The statistical analysis conducted on geographies consisting of 264,171,255 people shows a weak negative correlation between the proportion of Immigrants from Argentina and labor force participation rate among population between the ages 16 and 19 in the United States with a correlation coefficient (R) of -0.252 and weighted average of 32.9%. Similarly, the statistical analysis conducted on geographies consisting of 107,243,431 people shows a poor negative correlation between the proportion of Immigrants from Zaire and labor force participation rate among population between the ages 16 and 19 in the United States with a correlation coefficient (R) of -0.156 and weighted average of 40.7%, a difference of 23.7%.
In Labor Force | Age 16-19 Correlation Summary
| Measurement | Immigrants from Argentina | Immigrants from Zaire |
| Minimum | 9.8% | 13.3% |
| Maximum | 60.0% | 68.8% |
| Range | 50.2% | 55.5% |
| Mean | 30.2% | 41.3% |
| Median | 30.2% | 41.8% |
| Interquartile 25% (IQ1) | 25.5% | 34.8% |
| Interquartile 75% (IQ3) | 34.5% | 48.3% |
| Interquartile Range (IQR) | 9.0% | 13.6% |
| Standard Deviation (Sample) | 9.4% | 12.4% |
| Standard Deviation (Population) | 9.3% | 12.2% |
Similar Demographics by In Labor Force | Age 16-19
Demographics Similar to Immigrants from Argentina by In Labor Force | Age 16-19
In terms of in labor force | age 16-19, the demographic groups most similar to Immigrants from Argentina are Armenian (32.9%, a difference of 0.15%), Okinawan (32.8%, a difference of 0.24%), Belizean (32.8%, a difference of 0.38%), Iranian (33.0%, a difference of 0.40%), and Immigrants from Haiti (33.2%, a difference of 0.91%).
| Demographics | Rating | Rank | In Labor Force | Age 16-19 |
| Immigrants | South America | 0.1 /100 | #293 | Tragic 33.3% |
| Argentineans | 0.1 /100 | #294 | Tragic 33.3% |
| Yup'ik | 0.1 /100 | #295 | Tragic 33.3% |
| Jamaicans | 0.1 /100 | #296 | Tragic 33.2% |
| Immigrants | Haiti | 0.1 /100 | #297 | Tragic 33.2% |
| Iranians | 0.0 /100 | #298 | Tragic 33.0% |
| Armenians | 0.0 /100 | #299 | Tragic 32.9% |
| Immigrants | Argentina | 0.0 /100 | #300 | Tragic 32.9% |
| Okinawans | 0.0 /100 | #301 | Tragic 32.8% |
| Belizeans | 0.0 /100 | #302 | Tragic 32.8% |
| Immigrants | Dominica | 0.0 /100 | #303 | Tragic 32.5% |
| Israelis | 0.0 /100 | #304 | Tragic 32.4% |
| Nicaraguans | 0.0 /100 | #305 | Tragic 32.4% |
| Spanish American Indians | 0.0 /100 | #306 | Tragic 32.4% |
| Immigrants | Jamaica | 0.0 /100 | #307 | Tragic 32.2% |
Demographics Similar to Immigrants from Zaire by In Labor Force | Age 16-19
In terms of in labor force | age 16-19, the demographic groups most similar to Immigrants from Zaire are Immigrants from Laos (40.6%, a difference of 0.090%), Indonesian (40.7%, a difference of 0.10%), Cree (40.8%, a difference of 0.26%), Icelander (40.8%, a difference of 0.28%), and Carpatho Rusyn (40.8%, a difference of 0.33%).
| Demographics | Rating | Rank | In Labor Force | Age 16-19 |
| Europeans | 100.0 /100 | #44 | Exceptional 41.1% |
| Croatians | 100.0 /100 | #45 | Exceptional 41.1% |
| Immigrants | Sudan | 100.0 /100 | #46 | Exceptional 41.0% |
| Carpatho Rusyns | 100.0 /100 | #47 | Exceptional 40.8% |
| Icelanders | 100.0 /100 | #48 | Exceptional 40.8% |
| Cree | 100.0 /100 | #49 | Exceptional 40.8% |
| Indonesians | 100.0 /100 | #50 | Exceptional 40.7% |
| Immigrants | Zaire | 100.0 /100 | #51 | Exceptional 40.7% |
| Immigrants | Laos | 100.0 /100 | #52 | Exceptional 40.6% |
| Immigrants | Kenya | 100.0 /100 | #53 | Exceptional 40.5% |
| Tlingit-Haida | 100.0 /100 | #54 | Exceptional 40.5% |
| British | 100.0 /100 | #55 | Exceptional 40.5% |
| Fijians | 100.0 /100 | #56 | Exceptional 40.4% |
| Lithuanians | 100.0 /100 | #57 | Exceptional 40.4% |
| Aleuts | 100.0 /100 | #58 | Exceptional 40.4% |