Immigrants from Argentina vs Cypriot In Labor Force | Age 16-19
COMPARE
Immigrants from Argentina
Cypriot
In Labor Force | Age 16-19
In Labor Force | Age 16-19 Comparison
Immigrants from Argentina
Cypriots
32.9%
IN LABOR FORCE | AGE 16-19
0.0/ 100
METRIC RATING
300th/ 347
METRIC RANK
33.8%
IN LABOR FORCE | AGE 16-19
0.3/ 100
METRIC RATING
281st/ 347
METRIC RANK
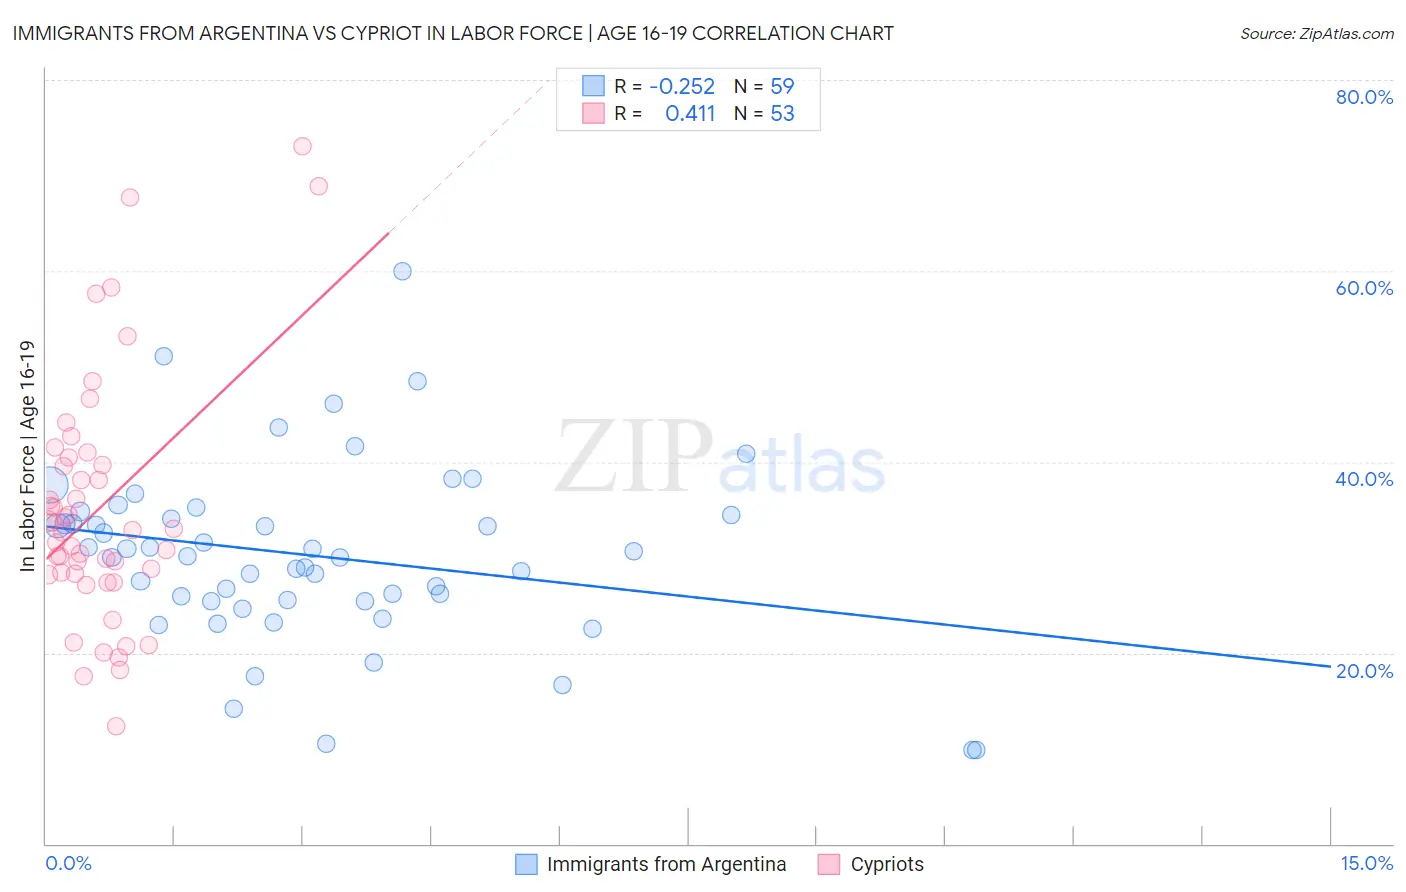
Immigrants from Argentina vs Cypriot In Labor Force | Age 16-19 Correlation Chart
The statistical analysis conducted on geographies consisting of 264,171,255 people shows a weak negative correlation between the proportion of Immigrants from Argentina and labor force participation rate among population between the ages 16 and 19 in the United States with a correlation coefficient (R) of -0.252 and weighted average of 32.9%. Similarly, the statistical analysis conducted on geographies consisting of 61,837,622 people shows a moderate positive correlation between the proportion of Cypriots and labor force participation rate among population between the ages 16 and 19 in the United States with a correlation coefficient (R) of 0.411 and weighted average of 33.8%, a difference of 2.9%.
In Labor Force | Age 16-19 Correlation Summary
| Measurement | Immigrants from Argentina | Cypriot |
| Minimum | 9.8% | 12.3% |
| Maximum | 60.0% | 73.0% |
| Range | 50.2% | 60.7% |
| Mean | 30.2% | 35.1% |
| Median | 30.2% | 32.9% |
| Interquartile 25% (IQ1) | 25.5% | 28.2% |
| Interquartile 75% (IQ3) | 34.5% | 40.1% |
| Interquartile Range (IQR) | 9.0% | 11.9% |
| Standard Deviation (Sample) | 9.4% | 12.8% |
| Standard Deviation (Population) | 9.3% | 12.7% |
Demographics Similar to Immigrants from Argentina and Cypriots by In Labor Force | Age 16-19
In terms of in labor force | age 16-19, the demographic groups most similar to Immigrants from Argentina are Armenian (32.9%, a difference of 0.15%), Iranian (33.0%, a difference of 0.40%), Immigrants from Haiti (33.2%, a difference of 0.91%), Jamaican (33.2%, a difference of 1.0%), and Yup'ik (33.3%, a difference of 1.1%). Similarly, the demographic groups most similar to Cypriots are Taiwanese (33.8%, a difference of 0.010%), Immigrants from Korea (33.8%, a difference of 0.010%), Immigrants from Venezuela (33.7%, a difference of 0.36%), Immigrants from Spain (33.7%, a difference of 0.42%), and U.S. Virgin Islander (33.6%, a difference of 0.61%).
| Demographics | Rating | Rank | In Labor Force | Age 16-19 |
| Taiwanese | 0.3 /100 | #280 | Tragic 33.8% |
| Cypriots | 0.3 /100 | #281 | Tragic 33.8% |
| Immigrants | Korea | 0.3 /100 | #282 | Tragic 33.8% |
| Immigrants | Venezuela | 0.2 /100 | #283 | Tragic 33.7% |
| Immigrants | Spain | 0.2 /100 | #284 | Tragic 33.7% |
| U.S. Virgin Islanders | 0.2 /100 | #285 | Tragic 33.6% |
| South Americans | 0.2 /100 | #286 | Tragic 33.6% |
| Nepalese | 0.1 /100 | #287 | Tragic 33.5% |
| Immigrants | Indonesia | 0.1 /100 | #288 | Tragic 33.5% |
| Immigrants | Singapore | 0.1 /100 | #289 | Tragic 33.5% |
| Immigrants | Colombia | 0.1 /100 | #290 | Tragic 33.5% |
| Immigrants | Belarus | 0.1 /100 | #291 | Tragic 33.4% |
| Haitians | 0.1 /100 | #292 | Tragic 33.4% |
| Immigrants | South America | 0.1 /100 | #293 | Tragic 33.3% |
| Argentineans | 0.1 /100 | #294 | Tragic 33.3% |
| Yup'ik | 0.1 /100 | #295 | Tragic 33.3% |
| Jamaicans | 0.1 /100 | #296 | Tragic 33.2% |
| Immigrants | Haiti | 0.1 /100 | #297 | Tragic 33.2% |
| Iranians | 0.0 /100 | #298 | Tragic 33.0% |
| Armenians | 0.0 /100 | #299 | Tragic 32.9% |
| Immigrants | Argentina | 0.0 /100 | #300 | Tragic 32.9% |