Immigrants from Argentina vs Slavic In Labor Force | Age 16-19
COMPARE
Immigrants from Argentina
Slavic
In Labor Force | Age 16-19
In Labor Force | Age 16-19 Comparison
Immigrants from Argentina
Slavs
32.9%
IN LABOR FORCE | AGE 16-19
0.0/ 100
METRIC RATING
300th/ 347
METRIC RANK
40.4%
IN LABOR FORCE | AGE 16-19
100.0/ 100
METRIC RATING
59th/ 347
METRIC RANK
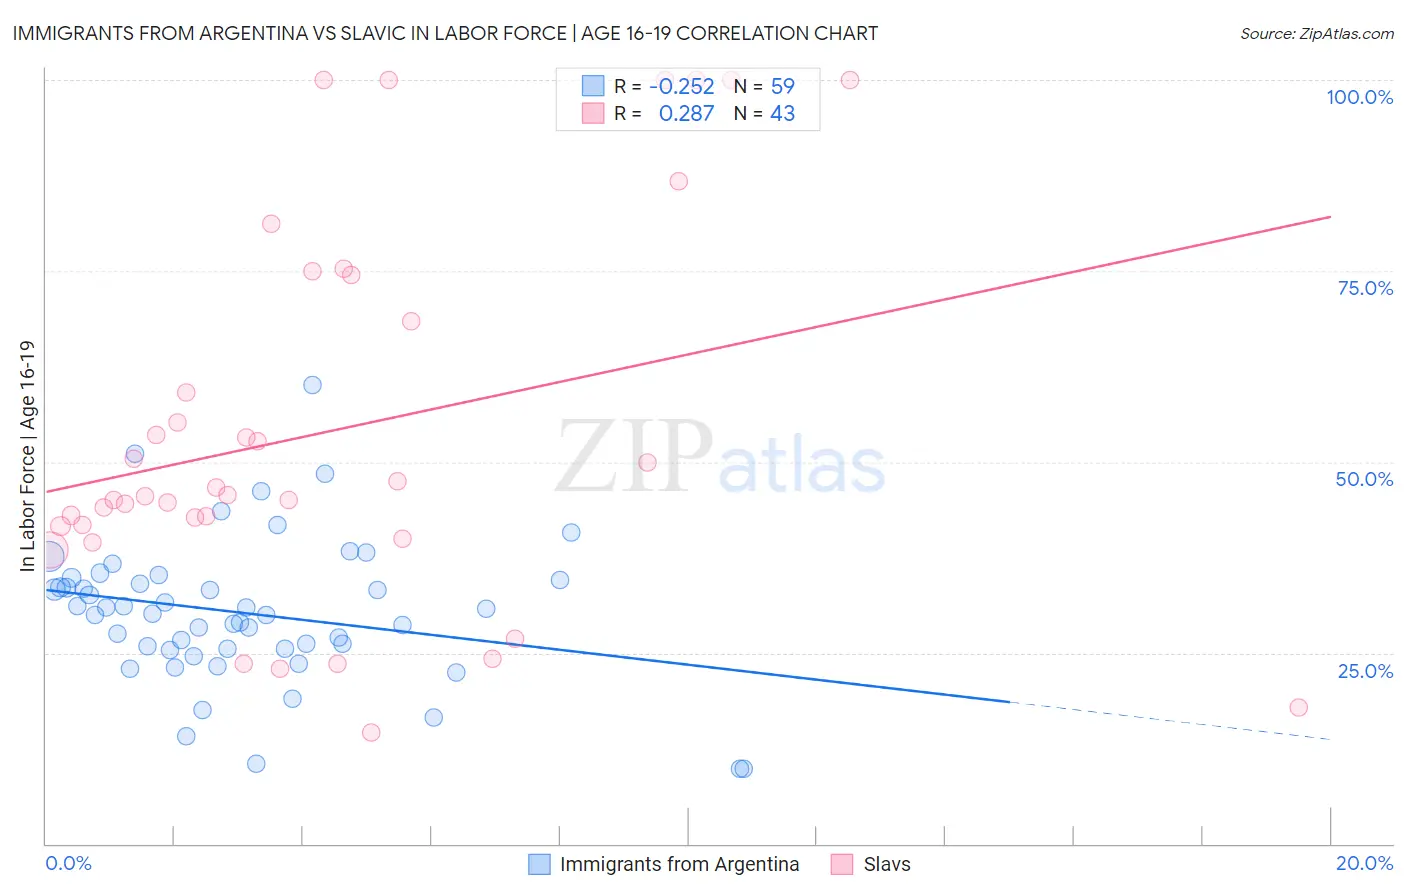
Immigrants from Argentina vs Slavic In Labor Force | Age 16-19 Correlation Chart
The statistical analysis conducted on geographies consisting of 264,171,255 people shows a weak negative correlation between the proportion of Immigrants from Argentina and labor force participation rate among population between the ages 16 and 19 in the United States with a correlation coefficient (R) of -0.252 and weighted average of 32.9%. Similarly, the statistical analysis conducted on geographies consisting of 270,628,141 people shows a weak positive correlation between the proportion of Slavs and labor force participation rate among population between the ages 16 and 19 in the United States with a correlation coefficient (R) of 0.287 and weighted average of 40.4%, a difference of 22.8%.
In Labor Force | Age 16-19 Correlation Summary
| Measurement | Immigrants from Argentina | Slavic |
| Minimum | 9.8% | 14.6% |
| Maximum | 60.0% | 100.0% |
| Range | 50.2% | 85.4% |
| Mean | 30.2% | 54.1% |
| Median | 30.2% | 45.6% |
| Interquartile 25% (IQ1) | 25.5% | 41.6% |
| Interquartile 75% (IQ3) | 34.5% | 74.5% |
| Interquartile Range (IQR) | 9.0% | 32.9% |
| Standard Deviation (Sample) | 9.4% | 24.6% |
| Standard Deviation (Population) | 9.3% | 24.3% |
Similar Demographics by In Labor Force | Age 16-19
Demographics Similar to Immigrants from Argentina by In Labor Force | Age 16-19
In terms of in labor force | age 16-19, the demographic groups most similar to Immigrants from Argentina are Armenian (32.9%, a difference of 0.15%), Okinawan (32.8%, a difference of 0.24%), Belizean (32.8%, a difference of 0.38%), Iranian (33.0%, a difference of 0.40%), and Immigrants from Haiti (33.2%, a difference of 0.91%).
| Demographics | Rating | Rank | In Labor Force | Age 16-19 |
| Immigrants | South America | 0.1 /100 | #293 | Tragic 33.3% |
| Argentineans | 0.1 /100 | #294 | Tragic 33.3% |
| Yup'ik | 0.1 /100 | #295 | Tragic 33.3% |
| Jamaicans | 0.1 /100 | #296 | Tragic 33.2% |
| Immigrants | Haiti | 0.1 /100 | #297 | Tragic 33.2% |
| Iranians | 0.0 /100 | #298 | Tragic 33.0% |
| Armenians | 0.0 /100 | #299 | Tragic 32.9% |
| Immigrants | Argentina | 0.0 /100 | #300 | Tragic 32.9% |
| Okinawans | 0.0 /100 | #301 | Tragic 32.8% |
| Belizeans | 0.0 /100 | #302 | Tragic 32.8% |
| Immigrants | Dominica | 0.0 /100 | #303 | Tragic 32.5% |
| Israelis | 0.0 /100 | #304 | Tragic 32.4% |
| Nicaraguans | 0.0 /100 | #305 | Tragic 32.4% |
| Spanish American Indians | 0.0 /100 | #306 | Tragic 32.4% |
| Immigrants | Jamaica | 0.0 /100 | #307 | Tragic 32.2% |
Demographics Similar to Slavs by In Labor Force | Age 16-19
In terms of in labor force | age 16-19, the demographic groups most similar to Slavs are Immigrants from Eastern Africa (40.4%, a difference of 0.040%), Aleut (40.4%, a difference of 0.13%), Lithuanian (40.4%, a difference of 0.15%), Fijian (40.4%, a difference of 0.17%), and American (40.3%, a difference of 0.19%).
| Demographics | Rating | Rank | In Labor Force | Age 16-19 |
| Immigrants | Laos | 100.0 /100 | #52 | Exceptional 40.6% |
| Immigrants | Kenya | 100.0 /100 | #53 | Exceptional 40.5% |
| Tlingit-Haida | 100.0 /100 | #54 | Exceptional 40.5% |
| British | 100.0 /100 | #55 | Exceptional 40.5% |
| Fijians | 100.0 /100 | #56 | Exceptional 40.4% |
| Lithuanians | 100.0 /100 | #57 | Exceptional 40.4% |
| Aleuts | 100.0 /100 | #58 | Exceptional 40.4% |
| Slavs | 100.0 /100 | #59 | Exceptional 40.4% |
| Immigrants | Eastern Africa | 100.0 /100 | #60 | Exceptional 40.4% |
| Americans | 100.0 /100 | #61 | Exceptional 40.3% |
| Cherokee | 100.0 /100 | #62 | Exceptional 40.2% |
| Northern Europeans | 100.0 /100 | #63 | Exceptional 40.2% |
| Immigrants | Micronesia | 100.0 /100 | #64 | Exceptional 40.2% |
| Kenyans | 100.0 /100 | #65 | Exceptional 40.1% |
| Immigrants | Nonimmigrants | 100.0 /100 | #66 | Exceptional 40.1% |