Immigrants from Argentina vs Brazilian Female Unemployment
COMPARE
Immigrants from Argentina
Brazilian
Female Unemployment
Female Unemployment Comparison
Immigrants from Argentina
Brazilians
5.2%
FEMALE UNEMPLOYMENT
78.7/ 100
METRIC RATING
148th/ 347
METRIC RANK
5.5%
FEMALE UNEMPLOYMENT
7.3/ 100
METRIC RATING
221st/ 347
METRIC RANK
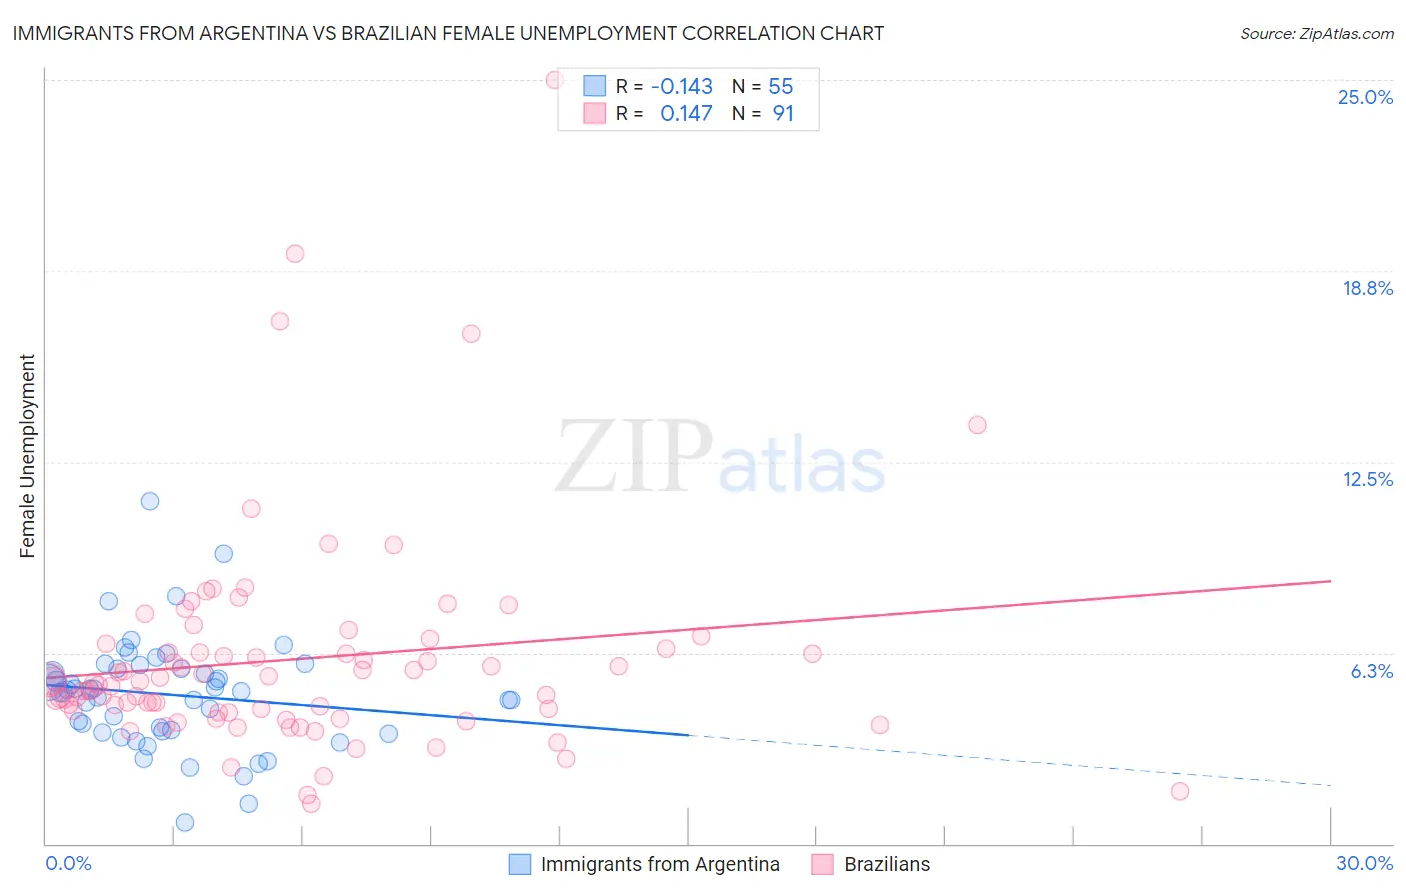
Immigrants from Argentina vs Brazilian Female Unemployment Correlation Chart
The statistical analysis conducted on geographies consisting of 263,999,591 people shows a poor negative correlation between the proportion of Immigrants from Argentina and unemploymnet rate among females in the United States with a correlation coefficient (R) of -0.143 and weighted average of 5.2%. Similarly, the statistical analysis conducted on geographies consisting of 323,090,102 people shows a poor positive correlation between the proportion of Brazilians and unemploymnet rate among females in the United States with a correlation coefficient (R) of 0.147 and weighted average of 5.5%, a difference of 5.9%.
Female Unemployment Correlation Summary
| Measurement | Immigrants from Argentina | Brazilian |
| Minimum | 0.70% | 1.3% |
| Maximum | 11.2% | 25.0% |
| Range | 10.5% | 23.7% |
| Mean | 4.9% | 6.0% |
| Median | 5.0% | 5.3% |
| Interquartile 25% (IQ1) | 3.7% | 4.3% |
| Interquartile 75% (IQ3) | 5.7% | 6.4% |
| Interquartile Range (IQR) | 2.1% | 2.1% |
| Standard Deviation (Sample) | 1.8% | 3.6% |
| Standard Deviation (Population) | 1.8% | 3.6% |
Similar Demographics by Female Unemployment
Demographics Similar to Immigrants from Argentina by Female Unemployment
In terms of female unemployment, the demographic groups most similar to Immigrants from Argentina are Asian (5.2%, a difference of 0.030%), Egyptian (5.2%, a difference of 0.040%), Argentinean (5.2%, a difference of 0.050%), Immigrants from Norway (5.2%, a difference of 0.060%), and Immigrants from Oceania (5.2%, a difference of 0.070%).
| Demographics | Rating | Rank | Female Unemployment |
| Immigrants | Eastern Europe | 81.5 /100 | #141 | Excellent 5.1% |
| Palestinians | 80.8 /100 | #142 | Excellent 5.1% |
| Immigrants | Kazakhstan | 80.7 /100 | #143 | Excellent 5.1% |
| Immigrants | Jordan | 80.4 /100 | #144 | Excellent 5.1% |
| Immigrants | Oceania | 79.5 /100 | #145 | Good 5.2% |
| Immigrants | Norway | 79.4 /100 | #146 | Good 5.2% |
| Argentineans | 79.2 /100 | #147 | Good 5.2% |
| Immigrants | Argentina | 78.7 /100 | #148 | Good 5.2% |
| Asians | 78.3 /100 | #149 | Good 5.2% |
| Egyptians | 78.3 /100 | #150 | Good 5.2% |
| Immigrants | China | 75.9 /100 | #151 | Good 5.2% |
| Immigrants | Italy | 75.0 /100 | #152 | Good 5.2% |
| Immigrants | Greece | 74.9 /100 | #153 | Good 5.2% |
| South Africans | 70.8 /100 | #154 | Good 5.2% |
| Immigrants | Egypt | 70.0 /100 | #155 | Good 5.2% |
Demographics Similar to Brazilians by Female Unemployment
In terms of female unemployment, the demographic groups most similar to Brazilians are Nicaraguan (5.5%, a difference of 0.020%), Delaware (5.5%, a difference of 0.030%), Iraqi (5.5%, a difference of 0.060%), Immigrants from Africa (5.4%, a difference of 0.25%), and South American (5.4%, a difference of 0.26%).
| Demographics | Rating | Rank | Female Unemployment |
| Seminole | 10.3 /100 | #214 | Poor 5.4% |
| Immigrants | Nicaragua | 10.2 /100 | #215 | Poor 5.4% |
| Comanche | 10.0 /100 | #216 | Poor 5.4% |
| Peruvians | 9.6 /100 | #217 | Tragic 5.4% |
| Bermudans | 9.0 /100 | #218 | Tragic 5.4% |
| South Americans | 8.6 /100 | #219 | Tragic 5.4% |
| Immigrants | Africa | 8.5 /100 | #220 | Tragic 5.4% |
| Brazilians | 7.3 /100 | #221 | Tragic 5.5% |
| Nicaraguans | 7.2 /100 | #222 | Tragic 5.5% |
| Delaware | 7.2 /100 | #223 | Tragic 5.5% |
| Iraqis | 7.1 /100 | #224 | Tragic 5.5% |
| French American Indians | 6.1 /100 | #225 | Tragic 5.5% |
| Immigrants | Peru | 5.9 /100 | #226 | Tragic 5.5% |
| Immigrants | Philippines | 5.3 /100 | #227 | Tragic 5.5% |
| Israelis | 4.8 /100 | #228 | Tragic 5.5% |