Immigrants from Africa vs Inupiat In Labor Force | Age 20-64
COMPARE
Immigrants from Africa
Inupiat
In Labor Force | Age 20-64
In Labor Force | Age 20-64 Comparison
Immigrants from Africa
Inupiat
80.4%
IN LABOR FORCE | AGE 20-64
99.6/ 100
METRIC RATING
47th/ 347
METRIC RANK
76.1%
IN LABOR FORCE | AGE 20-64
0.0/ 100
METRIC RATING
319th/ 347
METRIC RANK
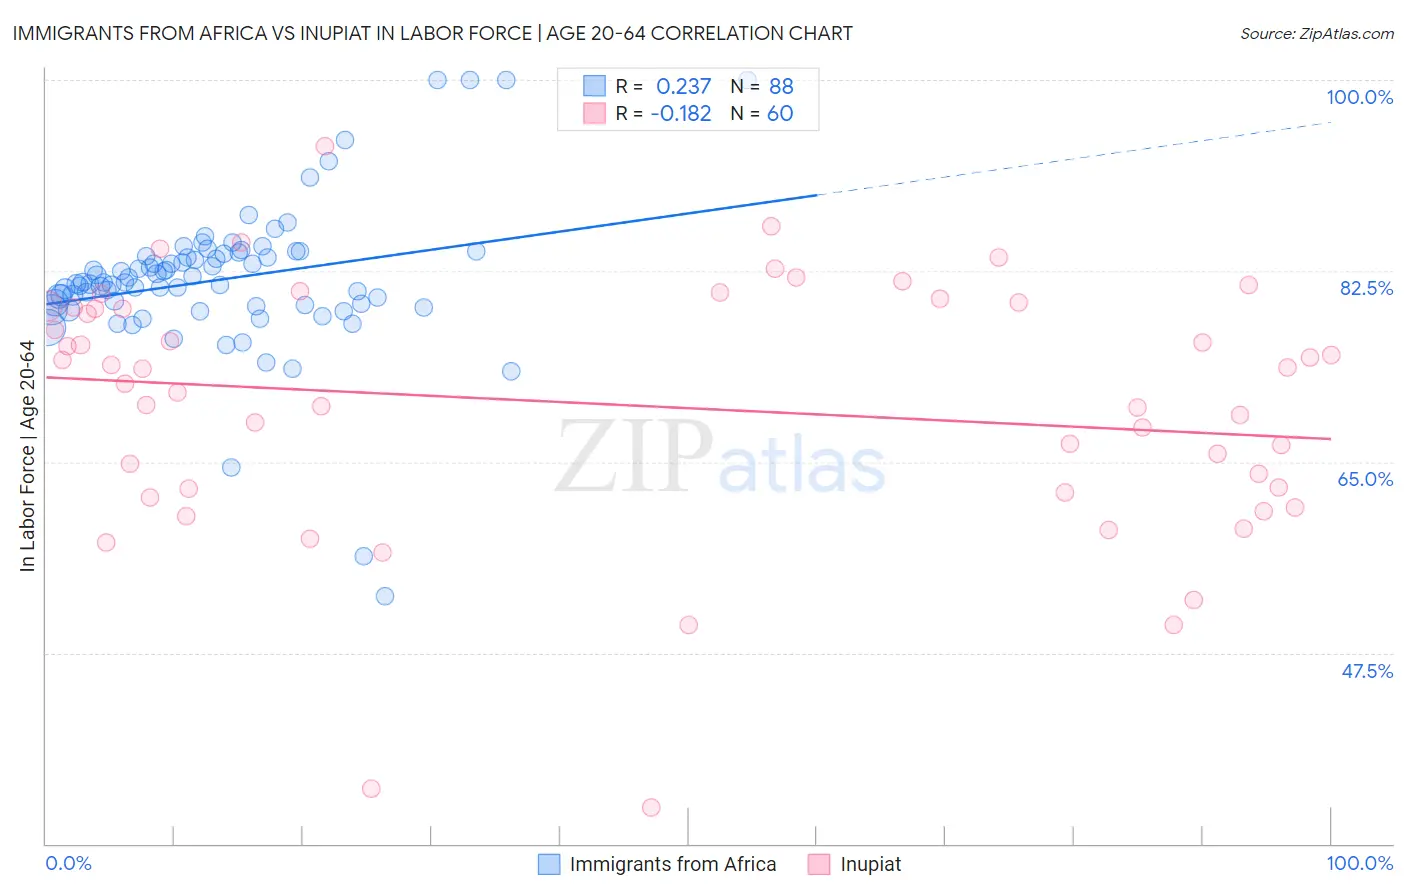
Immigrants from Africa vs Inupiat In Labor Force | Age 20-64 Correlation Chart
The statistical analysis conducted on geographies consisting of 469,448,483 people shows a weak positive correlation between the proportion of Immigrants from Africa and labor force participation rate among population between the ages 20 and 64 in the United States with a correlation coefficient (R) of 0.237 and weighted average of 80.4%. Similarly, the statistical analysis conducted on geographies consisting of 96,348,375 people shows a poor negative correlation between the proportion of Inupiat and labor force participation rate among population between the ages 20 and 64 in the United States with a correlation coefficient (R) of -0.182 and weighted average of 76.1%, a difference of 5.7%.
In Labor Force | Age 20-64 Correlation Summary
| Measurement | Immigrants from Africa | Inupiat |
| Minimum | 52.7% | 33.3% |
| Maximum | 100.0% | 93.9% |
| Range | 47.3% | 60.6% |
| Mean | 81.7% | 70.2% |
| Median | 81.4% | 72.8% |
| Interquartile 25% (IQ1) | 79.4% | 62.4% |
| Interquartile 75% (IQ3) | 83.9% | 79.2% |
| Interquartile Range (IQR) | 4.6% | 16.9% |
| Standard Deviation (Sample) | 6.9% | 11.9% |
| Standard Deviation (Population) | 6.9% | 11.8% |
Similar Demographics by In Labor Force | Age 20-64
Demographics Similar to Immigrants from Africa by In Labor Force | Age 20-64
In terms of in labor force | age 20-64, the demographic groups most similar to Immigrants from Africa are Immigrants from Hong Kong (80.4%, a difference of 0.020%), Slovene (80.5%, a difference of 0.040%), Immigrants from Pakistan (80.5%, a difference of 0.040%), Immigrants from Greece (80.4%, a difference of 0.060%), and Immigrants from Middle Africa (80.5%, a difference of 0.070%).
| Demographics | Rating | Rank | In Labor Force | Age 20-64 |
| Immigrants | Zimbabwe | 99.8 /100 | #40 | Exceptional 80.5% |
| Immigrants | Liberia | 99.8 /100 | #41 | Exceptional 80.5% |
| Latvians | 99.8 /100 | #42 | Exceptional 80.5% |
| Czechs | 99.7 /100 | #43 | Exceptional 80.5% |
| Immigrants | Middle Africa | 99.7 /100 | #44 | Exceptional 80.5% |
| Slovenes | 99.7 /100 | #45 | Exceptional 80.5% |
| Immigrants | Pakistan | 99.6 /100 | #46 | Exceptional 80.5% |
| Immigrants | Africa | 99.6 /100 | #47 | Exceptional 80.4% |
| Immigrants | Hong Kong | 99.5 /100 | #48 | Exceptional 80.4% |
| Immigrants | Greece | 99.4 /100 | #49 | Exceptional 80.4% |
| Immigrants | Sudan | 99.4 /100 | #50 | Exceptional 80.4% |
| Immigrants | Sri Lanka | 99.3 /100 | #51 | Exceptional 80.4% |
| Turks | 99.2 /100 | #52 | Exceptional 80.3% |
| Immigrants | Peru | 99.2 /100 | #53 | Exceptional 80.3% |
| Peruvians | 99.1 /100 | #54 | Exceptional 80.3% |
Demographics Similar to Inupiat by In Labor Force | Age 20-64
In terms of in labor force | age 20-64, the demographic groups most similar to Inupiat are Chickasaw (76.2%, a difference of 0.16%), Cherokee (76.2%, a difference of 0.21%), Yakama (75.8%, a difference of 0.38%), Yaqui (76.5%, a difference of 0.61%), and Seminole (75.5%, a difference of 0.74%).
| Demographics | Rating | Rank | In Labor Force | Age 20-64 |
| Alaskan Athabascans | 0.0 /100 | #312 | Tragic 76.9% |
| Shoshone | 0.0 /100 | #313 | Tragic 76.8% |
| Blacks/African Americans | 0.0 /100 | #314 | Tragic 76.8% |
| Ottawa | 0.0 /100 | #315 | Tragic 76.7% |
| Yaqui | 0.0 /100 | #316 | Tragic 76.5% |
| Cherokee | 0.0 /100 | #317 | Tragic 76.2% |
| Chickasaw | 0.0 /100 | #318 | Tragic 76.2% |
| Inupiat | 0.0 /100 | #319 | Tragic 76.1% |
| Yakama | 0.0 /100 | #320 | Tragic 75.8% |
| Seminole | 0.0 /100 | #321 | Tragic 75.5% |
| Dutch West Indians | 0.0 /100 | #322 | Tragic 75.5% |
| Cajuns | 0.0 /100 | #323 | Tragic 75.5% |
| Choctaw | 0.0 /100 | #324 | Tragic 75.4% |
| Menominee | 0.0 /100 | #325 | Tragic 75.3% |
| Creek | 0.0 /100 | #326 | Tragic 75.1% |