Vietnamese vs Inupiat In Labor Force | Age 20-64
COMPARE
Vietnamese
Inupiat
In Labor Force | Age 20-64
In Labor Force | Age 20-64 Comparison
Vietnamese
Inupiat
78.0%
IN LABOR FORCE | AGE 20-64
0.0/ 100
METRIC RATING
287th/ 347
METRIC RANK
76.1%
IN LABOR FORCE | AGE 20-64
0.0/ 100
METRIC RATING
319th/ 347
METRIC RANK
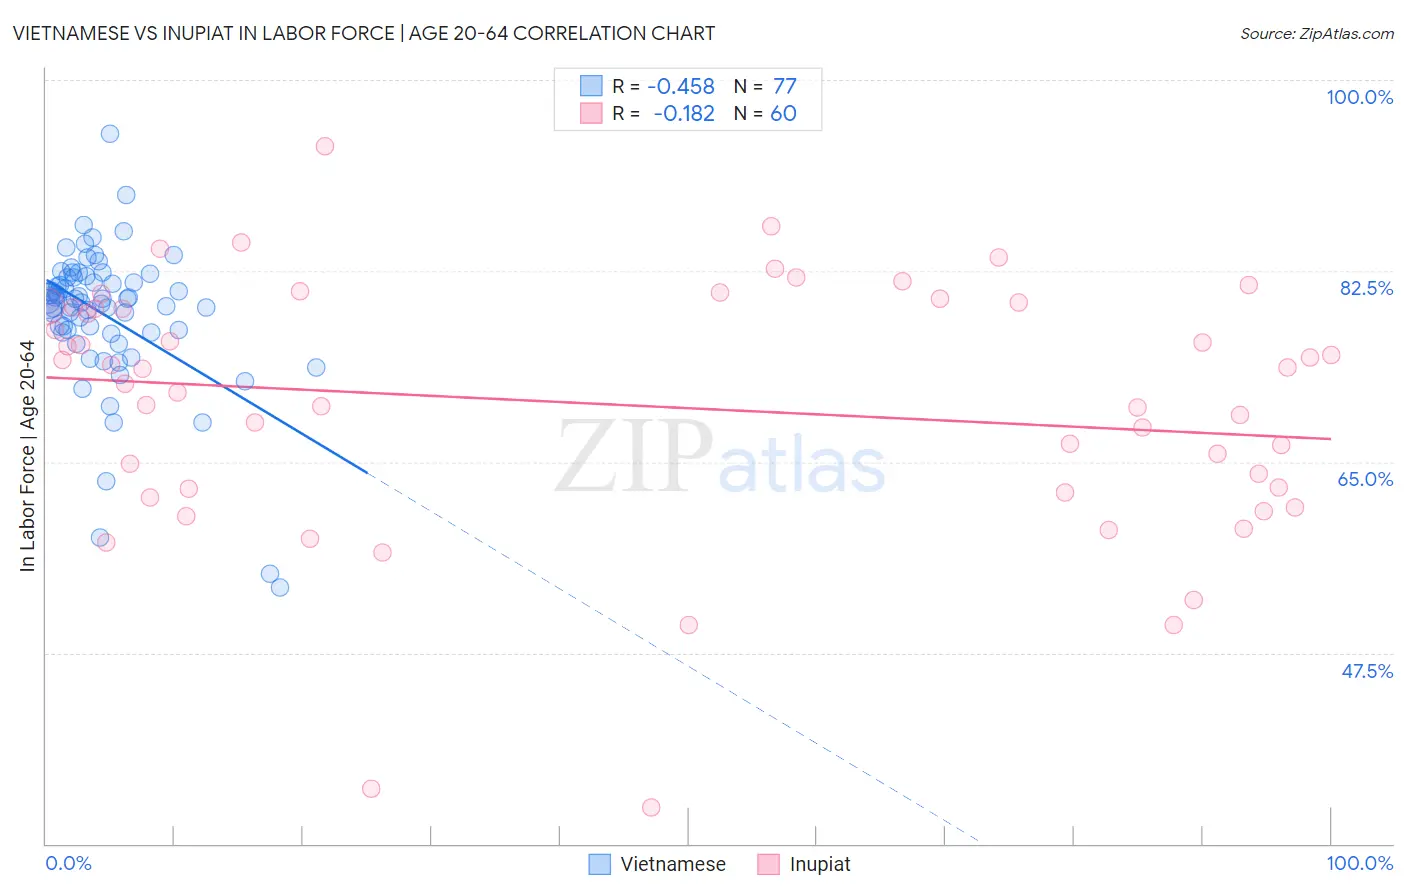
Vietnamese vs Inupiat In Labor Force | Age 20-64 Correlation Chart
The statistical analysis conducted on geographies consisting of 170,756,377 people shows a moderate negative correlation between the proportion of Vietnamese and labor force participation rate among population between the ages 20 and 64 in the United States with a correlation coefficient (R) of -0.458 and weighted average of 78.0%. Similarly, the statistical analysis conducted on geographies consisting of 96,348,375 people shows a poor negative correlation between the proportion of Inupiat and labor force participation rate among population between the ages 20 and 64 in the United States with a correlation coefficient (R) of -0.182 and weighted average of 76.1%, a difference of 2.5%.
In Labor Force | Age 20-64 Correlation Summary
| Measurement | Vietnamese | Inupiat |
| Minimum | 53.5% | 33.3% |
| Maximum | 95.1% | 93.9% |
| Range | 41.6% | 60.6% |
| Mean | 78.4% | 70.2% |
| Median | 79.7% | 72.8% |
| Interquartile 25% (IQ1) | 76.9% | 62.4% |
| Interquartile 75% (IQ3) | 81.9% | 79.2% |
| Interquartile Range (IQR) | 5.0% | 16.9% |
| Standard Deviation (Sample) | 6.6% | 11.9% |
| Standard Deviation (Population) | 6.6% | 11.8% |
Similar Demographics by In Labor Force | Age 20-64
Demographics Similar to Vietnamese by In Labor Force | Age 20-64
In terms of in labor force | age 20-64, the demographic groups most similar to Vietnamese are Immigrants from Belize (78.0%, a difference of 0.0%), Osage (78.0%, a difference of 0.010%), Hmong (77.9%, a difference of 0.070%), African (77.9%, a difference of 0.080%), and Immigrants from Bangladesh (77.9%, a difference of 0.10%).
| Demographics | Rating | Rank | In Labor Force | Age 20-64 |
| Immigrants | Dominica | 0.0 /100 | #280 | Tragic 78.1% |
| Guyanese | 0.0 /100 | #281 | Tragic 78.1% |
| Immigrants | St. Vincent and the Grenadines | 0.0 /100 | #282 | Tragic 78.1% |
| Immigrants | Nonimmigrants | 0.0 /100 | #283 | Tragic 78.1% |
| Immigrants | Guyana | 0.0 /100 | #284 | Tragic 78.1% |
| Osage | 0.0 /100 | #285 | Tragic 78.0% |
| Immigrants | Belize | 0.0 /100 | #286 | Tragic 78.0% |
| Vietnamese | 0.0 /100 | #287 | Tragic 78.0% |
| Hmong | 0.0 /100 | #288 | Tragic 77.9% |
| Africans | 0.0 /100 | #289 | Tragic 77.9% |
| Immigrants | Bangladesh | 0.0 /100 | #290 | Tragic 77.9% |
| Spanish Americans | 0.0 /100 | #291 | Tragic 77.8% |
| Immigrants | Azores | 0.0 /100 | #292 | Tragic 77.8% |
| Delaware | 0.0 /100 | #293 | Tragic 77.8% |
| Immigrants | Central America | 0.0 /100 | #294 | Tragic 77.7% |
Demographics Similar to Inupiat by In Labor Force | Age 20-64
In terms of in labor force | age 20-64, the demographic groups most similar to Inupiat are Chickasaw (76.2%, a difference of 0.16%), Cherokee (76.2%, a difference of 0.21%), Yakama (75.8%, a difference of 0.38%), Yaqui (76.5%, a difference of 0.61%), and Seminole (75.5%, a difference of 0.74%).
| Demographics | Rating | Rank | In Labor Force | Age 20-64 |
| Alaskan Athabascans | 0.0 /100 | #312 | Tragic 76.9% |
| Shoshone | 0.0 /100 | #313 | Tragic 76.8% |
| Blacks/African Americans | 0.0 /100 | #314 | Tragic 76.8% |
| Ottawa | 0.0 /100 | #315 | Tragic 76.7% |
| Yaqui | 0.0 /100 | #316 | Tragic 76.5% |
| Cherokee | 0.0 /100 | #317 | Tragic 76.2% |
| Chickasaw | 0.0 /100 | #318 | Tragic 76.2% |
| Inupiat | 0.0 /100 | #319 | Tragic 76.1% |
| Yakama | 0.0 /100 | #320 | Tragic 75.8% |
| Seminole | 0.0 /100 | #321 | Tragic 75.5% |
| Dutch West Indians | 0.0 /100 | #322 | Tragic 75.5% |
| Cajuns | 0.0 /100 | #323 | Tragic 75.5% |
| Choctaw | 0.0 /100 | #324 | Tragic 75.4% |
| Menominee | 0.0 /100 | #325 | Tragic 75.3% |
| Creek | 0.0 /100 | #326 | Tragic 75.1% |