Immigrants from Africa vs Immigrants from Germany In Labor Force | Age 20-64
COMPARE
Immigrants from Africa
Immigrants from Germany
In Labor Force | Age 20-64
In Labor Force | Age 20-64 Comparison
Immigrants from Africa
Immigrants from Germany
80.4%
IN LABOR FORCE | AGE 20-64
99.6/ 100
METRIC RATING
47th/ 347
METRIC RANK
78.8%
IN LABOR FORCE | AGE 20-64
1.0/ 100
METRIC RATING
247th/ 347
METRIC RANK
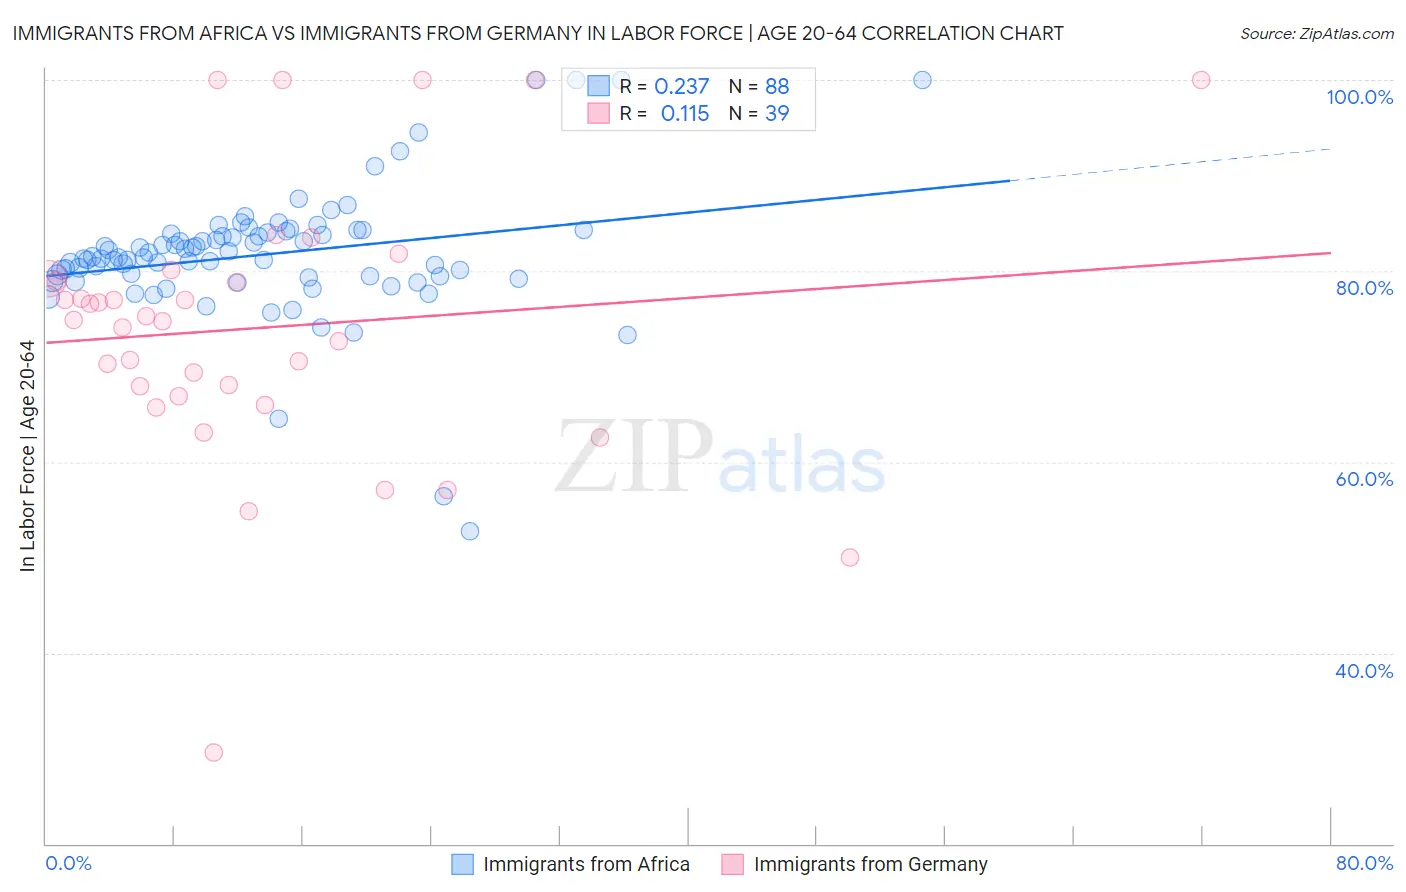
Immigrants from Africa vs Immigrants from Germany In Labor Force | Age 20-64 Correlation Chart
The statistical analysis conducted on geographies consisting of 469,448,483 people shows a weak positive correlation between the proportion of Immigrants from Africa and labor force participation rate among population between the ages 20 and 64 in the United States with a correlation coefficient (R) of 0.237 and weighted average of 80.4%. Similarly, the statistical analysis conducted on geographies consisting of 463,888,599 people shows a poor positive correlation between the proportion of Immigrants from Germany and labor force participation rate among population between the ages 20 and 64 in the United States with a correlation coefficient (R) of 0.115 and weighted average of 78.8%, a difference of 2.0%.
In Labor Force | Age 20-64 Correlation Summary
| Measurement | Immigrants from Africa | Immigrants from Germany |
| Minimum | 52.7% | 29.6% |
| Maximum | 100.0% | 100.0% |
| Range | 47.3% | 70.4% |
| Mean | 81.7% | 74.1% |
| Median | 81.4% | 74.9% |
| Interquartile 25% (IQ1) | 79.4% | 66.8% |
| Interquartile 75% (IQ3) | 83.9% | 79.1% |
| Interquartile Range (IQR) | 4.6% | 12.3% |
| Standard Deviation (Sample) | 6.9% | 14.4% |
| Standard Deviation (Population) | 6.9% | 14.2% |
Similar Demographics by In Labor Force | Age 20-64
Demographics Similar to Immigrants from Africa by In Labor Force | Age 20-64
In terms of in labor force | age 20-64, the demographic groups most similar to Immigrants from Africa are Immigrants from Hong Kong (80.4%, a difference of 0.020%), Slovene (80.5%, a difference of 0.040%), Immigrants from Pakistan (80.5%, a difference of 0.040%), Immigrants from Greece (80.4%, a difference of 0.060%), and Immigrants from Middle Africa (80.5%, a difference of 0.070%).
| Demographics | Rating | Rank | In Labor Force | Age 20-64 |
| Immigrants | Zimbabwe | 99.8 /100 | #40 | Exceptional 80.5% |
| Immigrants | Liberia | 99.8 /100 | #41 | Exceptional 80.5% |
| Latvians | 99.8 /100 | #42 | Exceptional 80.5% |
| Czechs | 99.7 /100 | #43 | Exceptional 80.5% |
| Immigrants | Middle Africa | 99.7 /100 | #44 | Exceptional 80.5% |
| Slovenes | 99.7 /100 | #45 | Exceptional 80.5% |
| Immigrants | Pakistan | 99.6 /100 | #46 | Exceptional 80.5% |
| Immigrants | Africa | 99.6 /100 | #47 | Exceptional 80.4% |
| Immigrants | Hong Kong | 99.5 /100 | #48 | Exceptional 80.4% |
| Immigrants | Greece | 99.4 /100 | #49 | Exceptional 80.4% |
| Immigrants | Sudan | 99.4 /100 | #50 | Exceptional 80.4% |
| Immigrants | Sri Lanka | 99.3 /100 | #51 | Exceptional 80.4% |
| Turks | 99.2 /100 | #52 | Exceptional 80.3% |
| Immigrants | Peru | 99.2 /100 | #53 | Exceptional 80.3% |
| Peruvians | 99.1 /100 | #54 | Exceptional 80.3% |
Demographics Similar to Immigrants from Germany by In Labor Force | Age 20-64
In terms of in labor force | age 20-64, the demographic groups most similar to Immigrants from Germany are Immigrants from Caribbean (78.8%, a difference of 0.010%), Immigrants from Trinidad and Tobago (78.8%, a difference of 0.020%), English (78.8%, a difference of 0.030%), Scottish (78.9%, a difference of 0.040%), and Honduran (78.8%, a difference of 0.040%).
| Demographics | Rating | Rank | In Labor Force | Age 20-64 |
| Trinidadians and Tobagonians | 2.3 /100 | #240 | Tragic 79.0% |
| Jamaicans | 2.0 /100 | #241 | Tragic 78.9% |
| Immigrants | Micronesia | 1.9 /100 | #242 | Tragic 78.9% |
| Immigrants | West Indies | 1.7 /100 | #243 | Tragic 78.9% |
| French | 1.5 /100 | #244 | Tragic 78.9% |
| Scottish | 1.3 /100 | #245 | Tragic 78.9% |
| Immigrants | Trinidad and Tobago | 1.1 /100 | #246 | Tragic 78.8% |
| Immigrants | Germany | 1.0 /100 | #247 | Tragic 78.8% |
| Immigrants | Caribbean | 1.0 /100 | #248 | Tragic 78.8% |
| English | 0.9 /100 | #249 | Tragic 78.8% |
| Hondurans | 0.8 /100 | #250 | Tragic 78.8% |
| Barbadians | 0.7 /100 | #251 | Tragic 78.8% |
| Immigrants | Honduras | 0.6 /100 | #252 | Tragic 78.7% |
| Basques | 0.5 /100 | #253 | Tragic 78.7% |
| Immigrants | Lebanon | 0.5 /100 | #254 | Tragic 78.7% |