Immigrants from Croatia vs Inupiat In Labor Force | Age 20-64
COMPARE
Immigrants from Croatia
Inupiat
In Labor Force | Age 20-64
In Labor Force | Age 20-64 Comparison
Immigrants from Croatia
Inupiat
80.1%
IN LABOR FORCE | AGE 20-64
97.6/ 100
METRIC RATING
80th/ 347
METRIC RANK
76.1%
IN LABOR FORCE | AGE 20-64
0.0/ 100
METRIC RATING
319th/ 347
METRIC RANK
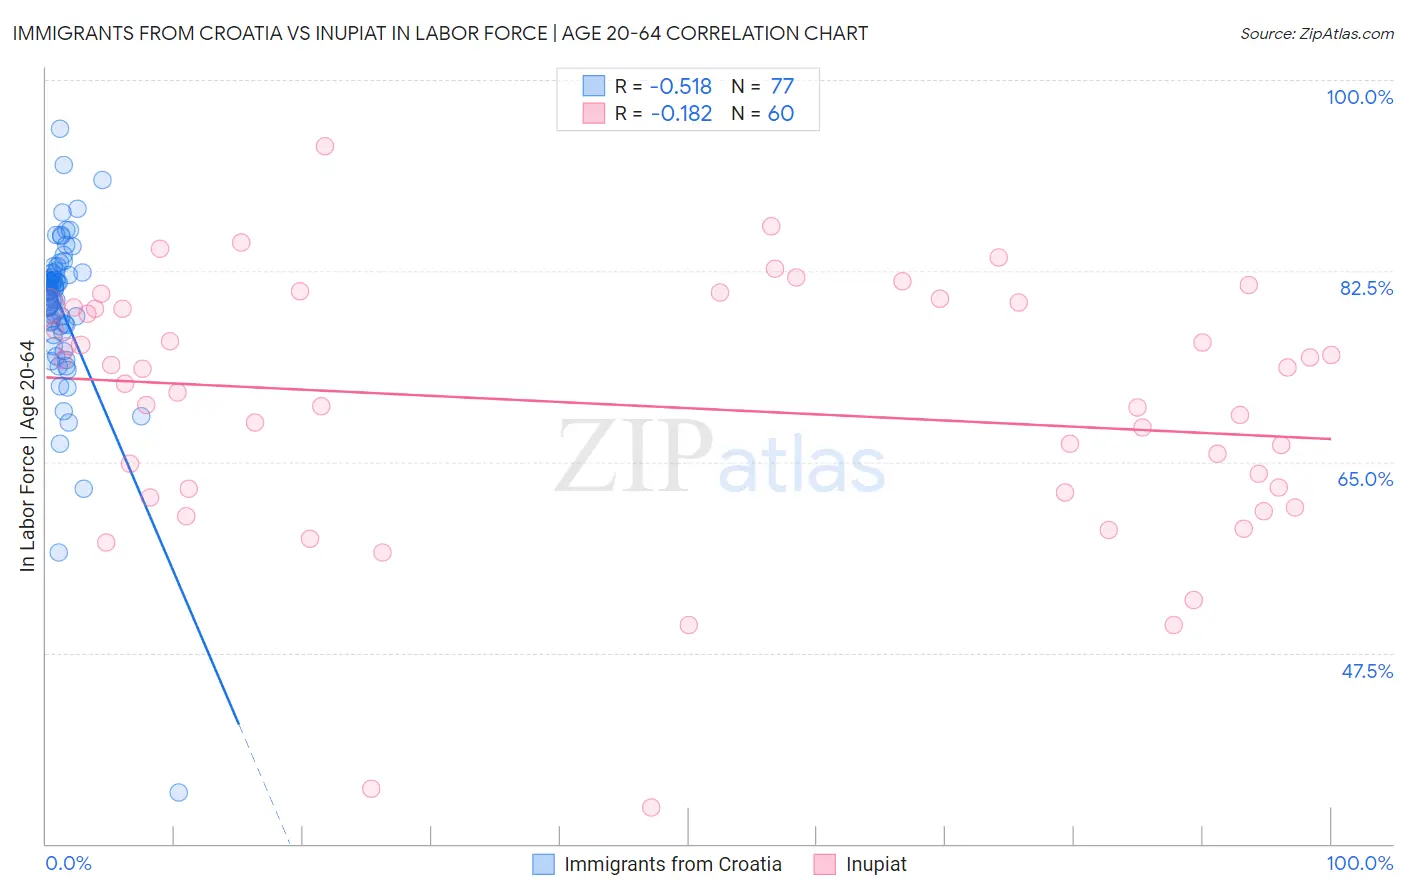
Immigrants from Croatia vs Inupiat In Labor Force | Age 20-64 Correlation Chart
The statistical analysis conducted on geographies consisting of 132,577,749 people shows a substantial negative correlation between the proportion of Immigrants from Croatia and labor force participation rate among population between the ages 20 and 64 in the United States with a correlation coefficient (R) of -0.518 and weighted average of 80.1%. Similarly, the statistical analysis conducted on geographies consisting of 96,348,375 people shows a poor negative correlation between the proportion of Inupiat and labor force participation rate among population between the ages 20 and 64 in the United States with a correlation coefficient (R) of -0.182 and weighted average of 76.1%, a difference of 5.4%.
In Labor Force | Age 20-64 Correlation Summary
| Measurement | Immigrants from Croatia | Inupiat |
| Minimum | 34.7% | 33.3% |
| Maximum | 95.5% | 93.9% |
| Range | 60.8% | 60.6% |
| Mean | 79.0% | 70.2% |
| Median | 80.6% | 72.8% |
| Interquartile 25% (IQ1) | 77.2% | 62.4% |
| Interquartile 75% (IQ3) | 82.4% | 79.2% |
| Interquartile Range (IQR) | 5.2% | 16.9% |
| Standard Deviation (Sample) | 7.9% | 11.9% |
| Standard Deviation (Population) | 7.9% | 11.8% |
Similar Demographics by In Labor Force | Age 20-64
Demographics Similar to Immigrants from Croatia by In Labor Force | Age 20-64
In terms of in labor force | age 20-64, the demographic groups most similar to Immigrants from Croatia are Asian (80.2%, a difference of 0.010%), Egyptian (80.2%, a difference of 0.020%), Immigrants from Colombia (80.2%, a difference of 0.020%), Immigrants from Romania (80.2%, a difference of 0.020%), and German Russian (80.1%, a difference of 0.020%).
| Demographics | Rating | Rank | In Labor Force | Age 20-64 |
| Cypriots | 98.2 /100 | #73 | Exceptional 80.2% |
| Immigrants | Eastern Europe | 98.1 /100 | #74 | Exceptional 80.2% |
| Immigrants | Afghanistan | 97.9 /100 | #75 | Exceptional 80.2% |
| Egyptians | 97.8 /100 | #76 | Exceptional 80.2% |
| Immigrants | Colombia | 97.8 /100 | #77 | Exceptional 80.2% |
| Immigrants | Romania | 97.8 /100 | #78 | Exceptional 80.2% |
| Asians | 97.7 /100 | #79 | Exceptional 80.2% |
| Immigrants | Croatia | 97.6 /100 | #80 | Exceptional 80.1% |
| German Russians | 97.3 /100 | #81 | Exceptional 80.1% |
| Immigrants | Japan | 97.3 /100 | #82 | Exceptional 80.1% |
| Colombians | 97.3 /100 | #83 | Exceptional 80.1% |
| Immigrants | Latvia | 97.2 /100 | #84 | Exceptional 80.1% |
| Jordanians | 97.2 /100 | #85 | Exceptional 80.1% |
| Immigrants | Egypt | 97.1 /100 | #86 | Exceptional 80.1% |
| Croatians | 97.1 /100 | #87 | Exceptional 80.1% |
Demographics Similar to Inupiat by In Labor Force | Age 20-64
In terms of in labor force | age 20-64, the demographic groups most similar to Inupiat are Chickasaw (76.2%, a difference of 0.16%), Cherokee (76.2%, a difference of 0.21%), Yakama (75.8%, a difference of 0.38%), Yaqui (76.5%, a difference of 0.61%), and Seminole (75.5%, a difference of 0.74%).
| Demographics | Rating | Rank | In Labor Force | Age 20-64 |
| Alaskan Athabascans | 0.0 /100 | #312 | Tragic 76.9% |
| Shoshone | 0.0 /100 | #313 | Tragic 76.8% |
| Blacks/African Americans | 0.0 /100 | #314 | Tragic 76.8% |
| Ottawa | 0.0 /100 | #315 | Tragic 76.7% |
| Yaqui | 0.0 /100 | #316 | Tragic 76.5% |
| Cherokee | 0.0 /100 | #317 | Tragic 76.2% |
| Chickasaw | 0.0 /100 | #318 | Tragic 76.2% |
| Inupiat | 0.0 /100 | #319 | Tragic 76.1% |
| Yakama | 0.0 /100 | #320 | Tragic 75.8% |
| Seminole | 0.0 /100 | #321 | Tragic 75.5% |
| Dutch West Indians | 0.0 /100 | #322 | Tragic 75.5% |
| Cajuns | 0.0 /100 | #323 | Tragic 75.5% |
| Choctaw | 0.0 /100 | #324 | Tragic 75.4% |
| Menominee | 0.0 /100 | #325 | Tragic 75.3% |
| Creek | 0.0 /100 | #326 | Tragic 75.1% |