Immigrants from Afghanistan vs Puget Sound Salish In Labor Force | Age 30-34
COMPARE
Immigrants from Afghanistan
Puget Sound Salish
In Labor Force | Age 30-34
In Labor Force | Age 30-34 Comparison
Immigrants from Afghanistan
Puget Sound Salish
84.5%
IN LABOR FORCE | AGE 30-34
23.5/ 100
METRIC RATING
194th/ 347
METRIC RANK
82.1%
IN LABOR FORCE | AGE 30-34
0.0/ 100
METRIC RATING
308th/ 347
METRIC RANK
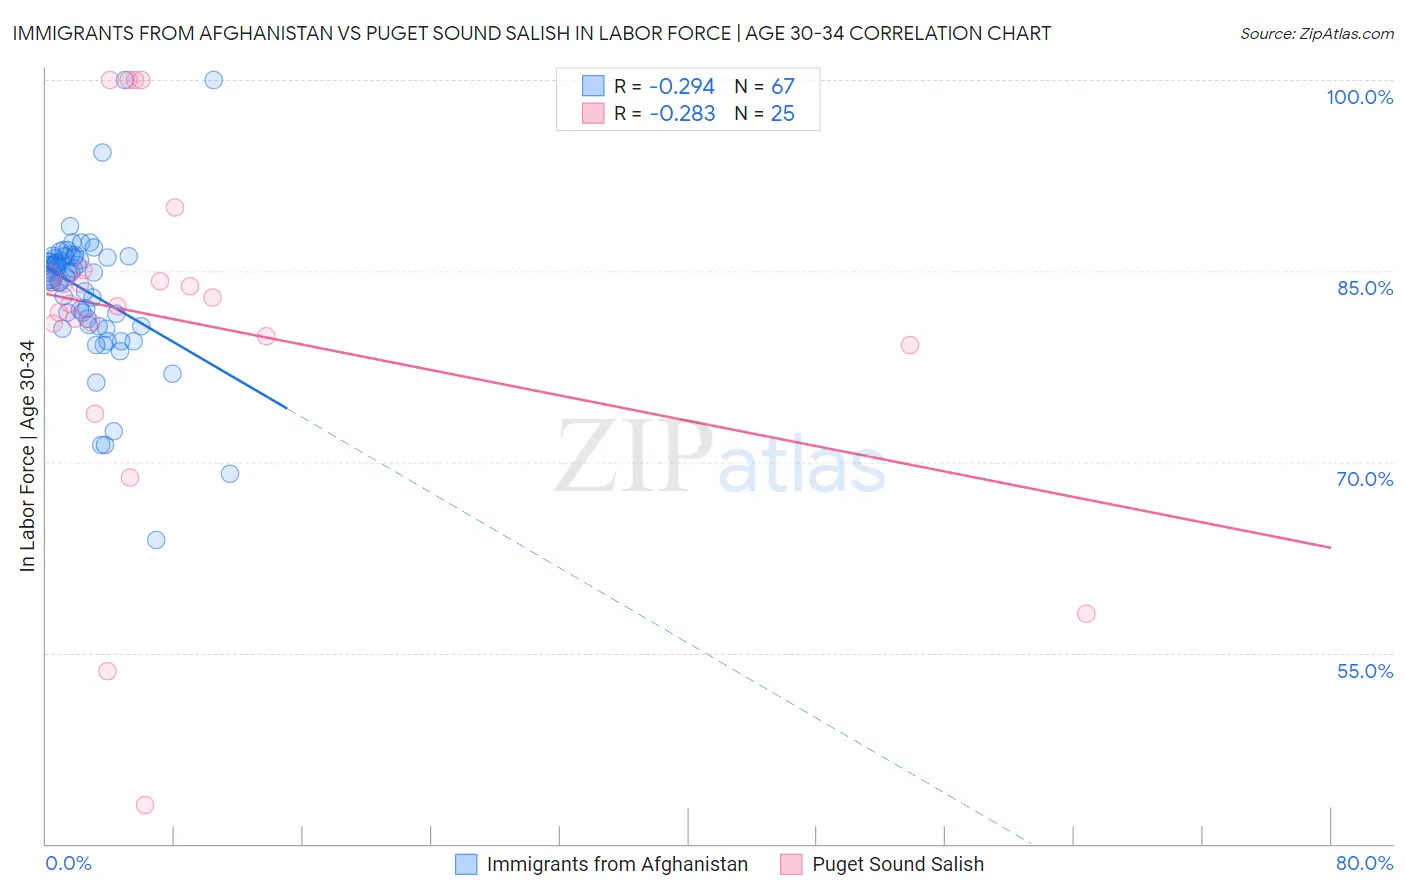
Immigrants from Afghanistan vs Puget Sound Salish In Labor Force | Age 30-34 Correlation Chart
The statistical analysis conducted on geographies consisting of 147,638,034 people shows a weak negative correlation between the proportion of Immigrants from Afghanistan and labor force participation rate among population between the ages 30 and 34 in the United States with a correlation coefficient (R) of -0.294 and weighted average of 84.5%. Similarly, the statistical analysis conducted on geographies consisting of 46,152,160 people shows a weak negative correlation between the proportion of Puget Sound Salish and labor force participation rate among population between the ages 30 and 34 in the United States with a correlation coefficient (R) of -0.283 and weighted average of 82.1%, a difference of 2.9%.
In Labor Force | Age 30-34 Correlation Summary
| Measurement | Immigrants from Afghanistan | Puget Sound Salish |
| Minimum | 63.9% | 43.0% |
| Maximum | 100.0% | 100.0% |
| Range | 36.1% | 57.0% |
| Mean | 83.4% | 81.0% |
| Median | 84.8% | 82.4% |
| Interquartile 25% (IQ1) | 80.7% | 79.5% |
| Interquartile 75% (IQ3) | 86.0% | 84.7% |
| Interquartile Range (IQR) | 5.3% | 5.2% |
| Standard Deviation (Sample) | 5.7% | 13.7% |
| Standard Deviation (Population) | 5.7% | 13.5% |
Similar Demographics by In Labor Force | Age 30-34
Demographics Similar to Immigrants from Afghanistan by In Labor Force | Age 30-34
In terms of in labor force | age 30-34, the demographic groups most similar to Immigrants from Afghanistan are Immigrants from Costa Rica (84.5%, a difference of 0.0%), Korean (84.5%, a difference of 0.0%), Hungarian (84.5%, a difference of 0.010%), Scandinavian (84.5%, a difference of 0.010%), and British (84.5%, a difference of 0.010%).
| Demographics | Rating | Rank | In Labor Force | Age 30-34 |
| Costa Ricans | 29.6 /100 | #187 | Fair 84.6% |
| Taiwanese | 29.4 /100 | #188 | Fair 84.6% |
| Nigerians | 28.9 /100 | #189 | Fair 84.5% |
| Immigrants | Zaire | 25.8 /100 | #190 | Fair 84.5% |
| Hungarians | 24.8 /100 | #191 | Fair 84.5% |
| Scandinavians | 24.7 /100 | #192 | Fair 84.5% |
| Immigrants | Costa Rica | 23.9 /100 | #193 | Fair 84.5% |
| Immigrants | Afghanistan | 23.5 /100 | #194 | Fair 84.5% |
| Koreans | 23.2 /100 | #195 | Fair 84.5% |
| British | 22.9 /100 | #196 | Fair 84.5% |
| Immigrants | Syria | 21.9 /100 | #197 | Fair 84.5% |
| Dutch | 20.2 /100 | #198 | Fair 84.5% |
| Immigrants | Thailand | 19.1 /100 | #199 | Poor 84.5% |
| Sub-Saharan Africans | 19.0 /100 | #200 | Poor 84.5% |
| Trinidadians and Tobagonians | 18.2 /100 | #201 | Poor 84.5% |
Demographics Similar to Puget Sound Salish by In Labor Force | Age 30-34
In terms of in labor force | age 30-34, the demographic groups most similar to Puget Sound Salish are Menominee (82.2%, a difference of 0.10%), Spanish American Indian (82.2%, a difference of 0.16%), Immigrants from Mexico (82.0%, a difference of 0.16%), Osage (82.3%, a difference of 0.17%), and Cajun (82.0%, a difference of 0.19%).
| Demographics | Rating | Rank | In Labor Force | Age 30-34 |
| Hispanics or Latinos | 0.0 /100 | #301 | Tragic 82.4% |
| Ottawa | 0.0 /100 | #302 | Tragic 82.4% |
| Immigrants | Micronesia | 0.0 /100 | #303 | Tragic 82.4% |
| Tlingit-Haida | 0.0 /100 | #304 | Tragic 82.3% |
| Osage | 0.0 /100 | #305 | Tragic 82.3% |
| Spanish American Indians | 0.0 /100 | #306 | Tragic 82.2% |
| Menominee | 0.0 /100 | #307 | Tragic 82.2% |
| Puget Sound Salish | 0.0 /100 | #308 | Tragic 82.1% |
| Immigrants | Mexico | 0.0 /100 | #309 | Tragic 82.0% |
| Cajuns | 0.0 /100 | #310 | Tragic 82.0% |
| Chickasaw | 0.0 /100 | #311 | Tragic 81.9% |
| Mexicans | 0.0 /100 | #312 | Tragic 81.9% |
| Iroquois | 0.0 /100 | #313 | Tragic 81.9% |
| Alaskan Athabascans | 0.0 /100 | #314 | Tragic 81.7% |
| Cherokee | 0.0 /100 | #315 | Tragic 81.6% |