Immigrants from Afghanistan vs Irish In Labor Force | Age 30-34
COMPARE
Immigrants from Afghanistan
Irish
In Labor Force | Age 30-34
In Labor Force | Age 30-34 Comparison
Immigrants from Afghanistan
Irish
84.5%
IN LABOR FORCE | AGE 30-34
23.5/ 100
METRIC RATING
194th/ 347
METRIC RANK
84.7%
IN LABOR FORCE | AGE 30-34
52.0/ 100
METRIC RATING
171st/ 347
METRIC RANK
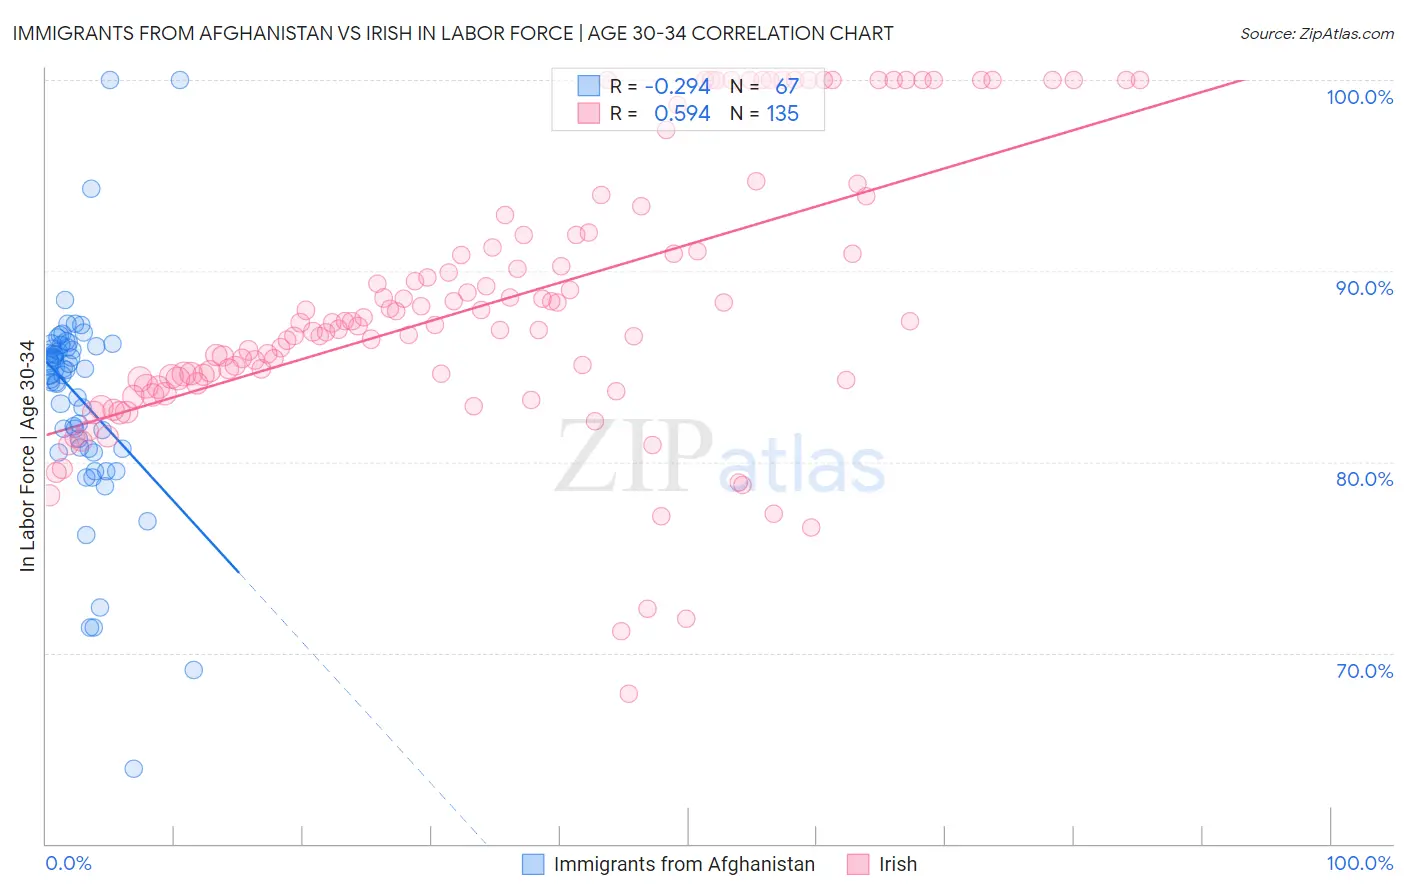
Immigrants from Afghanistan vs Irish In Labor Force | Age 30-34 Correlation Chart
The statistical analysis conducted on geographies consisting of 147,638,034 people shows a weak negative correlation between the proportion of Immigrants from Afghanistan and labor force participation rate among population between the ages 30 and 34 in the United States with a correlation coefficient (R) of -0.294 and weighted average of 84.5%. Similarly, the statistical analysis conducted on geographies consisting of 578,567,964 people shows a substantial positive correlation between the proportion of Irish and labor force participation rate among population between the ages 30 and 34 in the United States with a correlation coefficient (R) of 0.594 and weighted average of 84.7%, a difference of 0.22%.
In Labor Force | Age 30-34 Correlation Summary
| Measurement | Immigrants from Afghanistan | Irish |
| Minimum | 63.9% | 67.8% |
| Maximum | 100.0% | 100.0% |
| Range | 36.1% | 32.2% |
| Mean | 83.4% | 88.3% |
| Median | 84.8% | 87.3% |
| Interquartile 25% (IQ1) | 80.7% | 84.3% |
| Interquartile 75% (IQ3) | 86.0% | 91.9% |
| Interquartile Range (IQR) | 5.3% | 7.6% |
| Standard Deviation (Sample) | 5.7% | 7.1% |
| Standard Deviation (Population) | 5.7% | 7.1% |
Similar Demographics by In Labor Force | Age 30-34
Demographics Similar to Immigrants from Afghanistan by In Labor Force | Age 30-34
In terms of in labor force | age 30-34, the demographic groups most similar to Immigrants from Afghanistan are Immigrants from Costa Rica (84.5%, a difference of 0.0%), Korean (84.5%, a difference of 0.0%), Hungarian (84.5%, a difference of 0.010%), Scandinavian (84.5%, a difference of 0.010%), and British (84.5%, a difference of 0.010%).
| Demographics | Rating | Rank | In Labor Force | Age 30-34 |
| Costa Ricans | 29.6 /100 | #187 | Fair 84.6% |
| Taiwanese | 29.4 /100 | #188 | Fair 84.6% |
| Nigerians | 28.9 /100 | #189 | Fair 84.5% |
| Immigrants | Zaire | 25.8 /100 | #190 | Fair 84.5% |
| Hungarians | 24.8 /100 | #191 | Fair 84.5% |
| Scandinavians | 24.7 /100 | #192 | Fair 84.5% |
| Immigrants | Costa Rica | 23.9 /100 | #193 | Fair 84.5% |
| Immigrants | Afghanistan | 23.5 /100 | #194 | Fair 84.5% |
| Koreans | 23.2 /100 | #195 | Fair 84.5% |
| British | 22.9 /100 | #196 | Fair 84.5% |
| Immigrants | Syria | 21.9 /100 | #197 | Fair 84.5% |
| Dutch | 20.2 /100 | #198 | Fair 84.5% |
| Immigrants | Thailand | 19.1 /100 | #199 | Poor 84.5% |
| Sub-Saharan Africans | 19.0 /100 | #200 | Poor 84.5% |
| Trinidadians and Tobagonians | 18.2 /100 | #201 | Poor 84.5% |
Demographics Similar to Irish by In Labor Force | Age 30-34
In terms of in labor force | age 30-34, the demographic groups most similar to Irish are Immigrants from Peru (84.7%, a difference of 0.0%), South American Indian (84.7%, a difference of 0.0%), Immigrants from Burma/Myanmar (84.7%, a difference of 0.0%), Immigrants from England (84.7%, a difference of 0.0%), and Israeli (84.7%, a difference of 0.010%).
| Demographics | Rating | Rank | In Labor Force | Age 30-34 |
| Icelanders | 56.8 /100 | #164 | Average 84.7% |
| Immigrants | Western Europe | 56.7 /100 | #165 | Average 84.7% |
| Afghans | 55.2 /100 | #166 | Average 84.7% |
| Immigrants | South Eastern Asia | 54.2 /100 | #167 | Average 84.7% |
| Immigrants | Peru | 52.4 /100 | #168 | Average 84.7% |
| South American Indians | 52.1 /100 | #169 | Average 84.7% |
| Immigrants | Burma/Myanmar | 52.0 /100 | #170 | Average 84.7% |
| Irish | 52.0 /100 | #171 | Average 84.7% |
| Immigrants | England | 51.7 /100 | #172 | Average 84.7% |
| Israelis | 51.1 /100 | #173 | Average 84.7% |
| Finns | 50.0 /100 | #174 | Average 84.7% |
| Immigrants | South America | 50.0 /100 | #175 | Average 84.7% |
| Immigrants | Uzbekistan | 49.1 /100 | #176 | Average 84.7% |
| Laotians | 46.9 /100 | #177 | Average 84.7% |
| Okinawans | 44.1 /100 | #178 | Average 84.6% |