Immigrants from Kazakhstan vs Puget Sound Salish In Labor Force | Age 30-34
COMPARE
Immigrants from Kazakhstan
Puget Sound Salish
In Labor Force | Age 30-34
In Labor Force | Age 30-34 Comparison
Immigrants from Kazakhstan
Puget Sound Salish
85.3%
IN LABOR FORCE | AGE 30-34
98.1/ 100
METRIC RATING
89th/ 347
METRIC RANK
82.1%
IN LABOR FORCE | AGE 30-34
0.0/ 100
METRIC RATING
308th/ 347
METRIC RANK
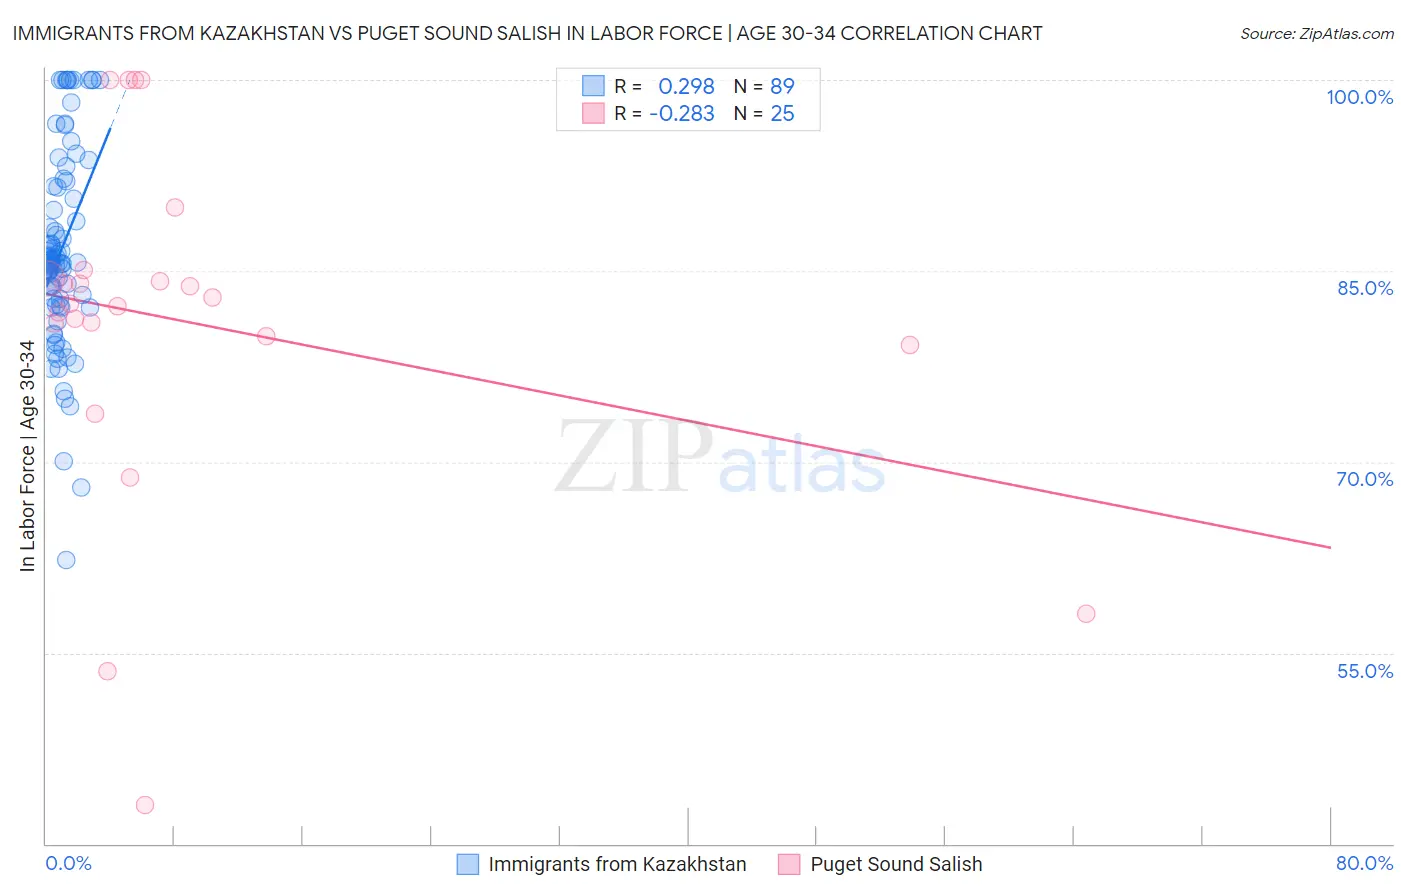
Immigrants from Kazakhstan vs Puget Sound Salish In Labor Force | Age 30-34 Correlation Chart
The statistical analysis conducted on geographies consisting of 124,415,463 people shows a weak positive correlation between the proportion of Immigrants from Kazakhstan and labor force participation rate among population between the ages 30 and 34 in the United States with a correlation coefficient (R) of 0.298 and weighted average of 85.3%. Similarly, the statistical analysis conducted on geographies consisting of 46,152,160 people shows a weak negative correlation between the proportion of Puget Sound Salish and labor force participation rate among population between the ages 30 and 34 in the United States with a correlation coefficient (R) of -0.283 and weighted average of 82.1%, a difference of 3.8%.
In Labor Force | Age 30-34 Correlation Summary
| Measurement | Immigrants from Kazakhstan | Puget Sound Salish |
| Minimum | 62.3% | 43.0% |
| Maximum | 100.0% | 100.0% |
| Range | 37.7% | 57.0% |
| Mean | 86.7% | 81.0% |
| Median | 85.7% | 82.4% |
| Interquartile 25% (IQ1) | 82.3% | 79.5% |
| Interquartile 75% (IQ3) | 91.8% | 84.7% |
| Interquartile Range (IQR) | 9.5% | 5.2% |
| Standard Deviation (Sample) | 7.8% | 13.7% |
| Standard Deviation (Population) | 7.8% | 13.5% |
Similar Demographics by In Labor Force | Age 30-34
Demographics Similar to Immigrants from Kazakhstan by In Labor Force | Age 30-34
In terms of in labor force | age 30-34, the demographic groups most similar to Immigrants from Kazakhstan are Immigrants from Northern Europe (85.3%, a difference of 0.010%), Immigrants from Belgium (85.3%, a difference of 0.010%), Immigrants from Taiwan (85.3%, a difference of 0.020%), Burmese (85.3%, a difference of 0.020%), and Immigrants from Moldova (85.3%, a difference of 0.020%).
| Demographics | Rating | Rank | In Labor Force | Age 30-34 |
| Immigrants | Africa | 98.6 /100 | #82 | Exceptional 85.3% |
| Immigrants | Europe | 98.6 /100 | #83 | Exceptional 85.3% |
| Greeks | 98.6 /100 | #84 | Exceptional 85.3% |
| Mongolians | 98.5 /100 | #85 | Exceptional 85.3% |
| Immigrants | Taiwan | 98.3 /100 | #86 | Exceptional 85.3% |
| Immigrants | Northern Europe | 98.2 /100 | #87 | Exceptional 85.3% |
| Immigrants | Belgium | 98.2 /100 | #88 | Exceptional 85.3% |
| Immigrants | Kazakhstan | 98.1 /100 | #89 | Exceptional 85.3% |
| Burmese | 97.9 /100 | #90 | Exceptional 85.3% |
| Immigrants | Moldova | 97.9 /100 | #91 | Exceptional 85.3% |
| German Russians | 97.7 /100 | #92 | Exceptional 85.2% |
| Immigrants | Norway | 97.6 /100 | #93 | Exceptional 85.2% |
| Swedes | 97.5 /100 | #94 | Exceptional 85.2% |
| Immigrants | India | 97.4 /100 | #95 | Exceptional 85.2% |
| Immigrants | Korea | 97.3 /100 | #96 | Exceptional 85.2% |
Demographics Similar to Puget Sound Salish by In Labor Force | Age 30-34
In terms of in labor force | age 30-34, the demographic groups most similar to Puget Sound Salish are Menominee (82.2%, a difference of 0.10%), Spanish American Indian (82.2%, a difference of 0.16%), Immigrants from Mexico (82.0%, a difference of 0.16%), Osage (82.3%, a difference of 0.17%), and Cajun (82.0%, a difference of 0.19%).
| Demographics | Rating | Rank | In Labor Force | Age 30-34 |
| Hispanics or Latinos | 0.0 /100 | #301 | Tragic 82.4% |
| Ottawa | 0.0 /100 | #302 | Tragic 82.4% |
| Immigrants | Micronesia | 0.0 /100 | #303 | Tragic 82.4% |
| Tlingit-Haida | 0.0 /100 | #304 | Tragic 82.3% |
| Osage | 0.0 /100 | #305 | Tragic 82.3% |
| Spanish American Indians | 0.0 /100 | #306 | Tragic 82.2% |
| Menominee | 0.0 /100 | #307 | Tragic 82.2% |
| Puget Sound Salish | 0.0 /100 | #308 | Tragic 82.1% |
| Immigrants | Mexico | 0.0 /100 | #309 | Tragic 82.0% |
| Cajuns | 0.0 /100 | #310 | Tragic 82.0% |
| Chickasaw | 0.0 /100 | #311 | Tragic 81.9% |
| Mexicans | 0.0 /100 | #312 | Tragic 81.9% |
| Iroquois | 0.0 /100 | #313 | Tragic 81.9% |
| Alaskan Athabascans | 0.0 /100 | #314 | Tragic 81.7% |
| Cherokee | 0.0 /100 | #315 | Tragic 81.6% |